N.RN-Using the iPad for Peer Review with Rational Exponents

Attached is an article explaining how the MyScript Calculator ipad app can be used to check open-ended student responses. Student can show mathematical understanding by writing a math expression or equation of their choosing with their finger and see if the app interprets their notation and solution as intended. Teachers can use this app as a teaching tool by requiring students to suggest a math problem with a worked solution that they feel demonstrates their mastery of a learning target and have the app check their work. The MyScript Calculator can be used to check both the correctness of their notation and solution.

The teacher can use this app for whole class instruction can use this resource by putting the iPad under a document camera or by using screen share software. Teachers can also using this resource for small groups or individual students by giving an iPad to each group or individual. Internet access is not needed because the MyScript Calculator app does not use the internet when operating.

Article and Worksheet Rational Exponents with MyScript Calculator App

Rational Exponents Worksheet

Implementing Student Voice into Mathematics Teaching

Just like Performance-Expectations (PE) Student-Voice is a Washington State term that refers to teaching practices focused on the student involvement. Some of the principles of Student-Voice are: 1. Eliciting student understanding of the learning targets; 2. Supporting student use of resources to learn and monitor their own progress; and 3. Teachers reflection on Student-Voice evidence to improve instruction. Recently two mathematics masters students and Washington State teacher conducted action research projects related to Student-Voice. The reading of these action research projects will help mathematics teachers and pre-service teachers understand what Student-Voice is, why it is important, and how to implement teaching practices related to this area teaching best practices.
Emphasizing Performance Expectations to Increase Student Achievement, by Jennifer Coulson Emphasizing PE to Increase Math Achievement-Jennifer Coulson

Using Learning Targets to Encourage Student Self Assessment and Increase Student Achievement in Geometry, by Katelyn Marie Pierce UsingLearningTargets_Geometry_Pierce_project

Resources for aligning district assessments with CCSS-Math

Smarter Balance Assessment Consortium
Washington State is part of an assessment consortium to develop an assessment system aligned with the Common Core State Standards. The assessments will be computer-adaptive and will be administered in grades 3-8 and 11. The summative assessments will be administered during the last 12 weeks of the school year but they are also developing formative assessments some of which are computer-adaptive and some of which are paper and pencil.

As a math education professional you are encouraged to review and participate in the development and implementation of these assessments. The pilot tests have already begun so get involved.

Illustrative Mathematics
This website is a collaborative resource for sharing and using math items aligned with the CCSSM.

Common Core State Standards Mathematics – CCSSM

Here are some resources for the CCSSM. Become part of the solution to more effective mathematics teaching by using all possible resources to improve student achievement in mathematics.

Video Explanation

Common Core Documents
CCSSI_Math Standards
CCSSI_Mathematics_Appendix_A
Mathematics – Alignment Analysis Common Core and Washington State Standards, Hanover Research
Mathematics – Alignment Analysis Washington State
Transition Algebra I
Transition Geometry

Websites:
Common Core
University of Wisconsin
Mind on Mathematics Blog
Education Northwest
Progressions for the CCSSM
Ohio CCSSM
Smarter Balanced Assessment Consortium

Hello Mathematics Teachers!

We mathematics teachers have more focus on our occupations that ever before.  We have a public debate about education that is spilling over into the movies and editorials such as the article reacting the to the documentary “Waiting for Superman” http://www.edweek.org/ew/articles/2010/10/20/08liebowitz.h30.html?r=8 .Some like this attention and others do not but all of us need to view this attention as an opportunity to improve mathematics education.  I feel that the number one issue that needs to be addressed in the Achievement Gap.  There is an achievement gap between how our student perform in mathematics and how well they need to perform to meet the challenges of the future.  There is also a mathematics achievement gap between groups of students in the United States identified in many ways but I will use the term at-risk.  These students for many reasons are not succeeding in our public education system.

NCTM Position statement

Every student should have equitable and optimal opportunities to learn mathematics free from bias—intentional or unintentional—based on race, gender, socioeconomic status, or language. In order to close the achievement gap, all students need the opportunity to learn challenging mathematics from a well-qualified teacher who will make connections to the background, needs, and cultures of all learners.

I am totally convinced that mathematics teachers can, in the spirit of collaboration build better classrooms for learning mathematics.  This new classroom needs to be an environment where students are expected to think mathematically.  This means students will solve relevant problems and explain their solutions in understandable terms.

I also see that teachers need to do a better job of collecting and using assessment data to make instructional decision to improve mathematics achievement.  Along with the drive to use data to improve our classrooms we need to document and disseminate this information and changes to a society that is calling for accountability.  The national report on the need for effective math teachers can be found at http://www.nctm.org/news/content.aspx?id=14391.

Amusement Park 7.G.B

During this lesson, students will  be put to the test, using their prior knowledge from the previous geometry unit on two- and three-dimensional shapes involving area and perimeter.

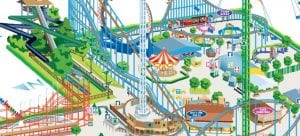
You and your team have just been hired by Walt Disney Parks and Resorts Worldwide to landscape a brand new amusement park with rides. WDPR has provided you with a blank map with letters E through M, representing the nine rides that you must include in your design. Your task is to map out the most effective design in order to maximize the number of visitors to each ride. Your job is to gather all of the information you can, map out each ride using GeoGebra to graph your park, and present a justification as to why your design will maximize visitors to each of your rides.

In order to complete this lesson, students will be split into groups of 3-5. The class as a whole will have a set number of rides they must include in their park, and a set area for the park itself, but each group will devise different ride sizes and configurations throughout the map in order to maximize visitors to each ride.


Modeling Lesson-1xyl8m6

Picture Problem Painted Cube 6.EE

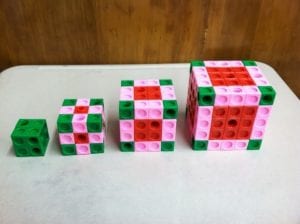
The painted cube problem is deceptively complex, and has multiple levels of understanding applied to it. Students are shown a cube broken up into smaller sections. The cube has been painted with a particular pattern based on what faces are visible from the outside of the cube. Sections with one face exposed are painted red on that exposed side. Sections with two exposed sizes are painted pink. Sections with three exposed sides are painted green. Sections with no exposed sides are unpainted, or are clear. Student’s jobs are to count how many of each painted cube there are in a given cube, as well as to devise functions so as to quickly count out how many of a particular section there are. Their answers would be written out in table form; said tables would be given to them. Students can also be asked to find out how much surface area there is in these cubes, assuming that each section is 1 inch on each side.

CCSS.Math.Content.6.EE.A.1

Write and evaluate numerical expressions involving whole-number exponents.

CCSS.Math.Content.6.EE.A.2

Write, read, and evaluate expressions in which letters stand for numbers.

CCSS.Math.Content.6.EE.B.5

Understand solving an equation or inequality as a process of answering a question: which values from a specified set, if any, make the equation or inequality true? Use substitution to determine whether a given number in a specified set makes an equation or inequality true.

CCSS.Math.Content.6.EE.B.6

Use variables to represent numbers and write expressions when solving a real-world or mathematical problem; understand that a variable can represent an unknown number, or, depending on the purpose at hand, any number in a specified set.

CCSS.Math.Content.8.EE.A.2

Use square root and cube root symbols to represent solutions to equations of the form x2 = p and x3 = p, where p is a positive rational number. Evaluate square roots of small perfect squares and cube roots of small perfect cubes. Know that √2 is irrational.

2x2x2 cube Green Pink Red unpainted
How many?
What’s the equation?


3x3x3 cube Green Pink Red unpainted
How many? 12
What’s the equation?


4x4x4 cube Green Pink Red unpainted
How many?
What’s the equation?


5x5x5 cube Green Pink Red unpainted
How many? 54
What’s the equation?


NxNxN Green Pink Red unpainted
How many? 4n 6(n-2)^2
What’s the equation?


Cookie Monster or Monster Cookie? 7.G.B.6, MP1, MP2


Cookie monster? More like monster of a cookie…

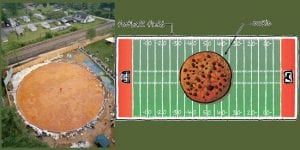
The world’s largest cookie was baked by Immaculate Baking Company in Flat Rock, North Carolina in 2003. The area of the top of this cookie was 8,120 square feet with a diameter of 101 feet and weighed 40,000 pounds. Assuming that the cookie is a perfect cylinder, and its height was 6 inches, what is its volume? Round to the nearest cubic foot.

If there was an oven that could fit this cookie inside, what is the smallest volume size that the oven could be? (Hint: the oven must be a cube).

In this lesson, students will be using their knowledge of area and volume as well as mathematical reasoning to solve a problem that involving circles, cylinders, and cubes. The picture and the problem will intrigue students because they won’t believe that a real cookie was this big until they see it for themselves. Plus, who doesn’t love cookies? The teacher could also gain incentive and interest from the students by bringing in or having the students bring in cookies after the lesson.


CCSS.MATH.CONTENT.7.G.B.6

Solve real-world and mathematical problems involving area, volume, and surface area of two- and three-dimensional objects composed of triangles, quadrilaterals, polygons, cubes, and right prisms.

CCSS.MATH.PRACTICE.MP1

Make sense of problems and persevere in solving them.

CCSS.MATH.PRACTICE.MP2

Reason abstractly and quantitatively.

Slopes of Parallel and Perpendicular Lines HSG.GPE.B.5

This learning progression is based on the students being able find the slopes of lines and determine if two lines are parallel or perpendicular based on their slopes. It a compilation of three math tasks that will help students understand how to find the slope of a line, classify lines as parallel or perpendicular, and writing equations in slope intercept and point slope forms.

Students will use the slope formula to find the slope a line that is graphed as well as find the slope of a line when two points for a line are given.

  • MATH.CONTENT.HSG.GPE.B.5– Prove the slope criteria for parallel and perpendicular lines and use them to solve geometric problems (e.g., find the equation of a line parallel or perpendicular to a given line that passes through a given point).

Students will be using the slopes of two different lines to determine if they are parallel or perpendicular. They will recognize that parallel lines have the same slope and slopes for perpendicular lines are opposite reciprocals.

  • MATH.CONTENT.HSG.CO.C.9– Prove theorems about lines and angles.

Students will learn to write equations in point slope form and slope intercept form. They will use the information from these equations, as well as knowledge from the previous tasks to graph lines.

  • MATH.CONTENT.HSS.ID.C.7– Interpret the slope (rate of change) and the intercept (constant term) of a linear model in the context of the data.

Formative assessment in the form of observation and discussion will be the primary procedure to support student learning. I will observe how they are finding solutions and ask them questions about their understanding of the learning targets.  At the end of each task students will be given a handout, which will also show how well they are able to meet the learning targets.

Slopes of Parallel and Perpendicular Lines Learning Progression

Proportion and Similarity HSG.SRT.A.2


This learning progression is provided to support student’s understanding of ratios and proportionality in relation to similar figures. There is a series of three consecutive math tasks that will be completed by students to help guide them through using ratios and proportions to prove figures are similar.

Students will use their knowledge of algebra to express proper ratios and simplify them correctly. They will also be using the cross product of ratios to solve the proportions.

  • MATH.CONTENT.HSA.SSE.B.3-Choose and produce an equivalent form of an expression to reveal and explain properties of the quantity represented by the expression.

Students will identify congruent angles and corresponding sides of a polygon so they can find the similarity ratio. Once they do this, they will be able to recognize the sides and angles that are proportional and determine if polygons are similar.

  • MATH.CONTENT.HSG.SRT.A.2-Given two figures, use the definition of
    similarity in terms of similarity transformations to decide if they are similar; explain using similarity transformations the meaning of similarity for triangles as the equality of all corresponding pairs of angles and the proportionality of all corresponding pairs of sides.

Students will use triangle similarity theorems to show how congruent angles and corresponding sides that are proportional determine if triangles are similar.

  • MATH.CONTENT.HSG.SRT.A.3-Use the properties of similarity transformations to establish the AA criterion for two triangles to be similar.

Formative assessment in the form of observation and discussion will be the primary procedure to support student learning. I will observe how they are finding solutions and ask them questions about their understanding of the learning targets.  At the end of each task students will be given a handout, which will also show how well they are able to meet the learning targets.

Proportion and Similarity Learning Progression

Trigonometry Ratios G.SRT

This learning progression will take place at a 9th grade Algebra 1 classroom. The class is consisted of 32 students where the students have an individual sitting arrangements. This allows the students to work on their own and makes it easy to work with a partner as well. The book use for this class is “Geometry: Integration, Applications, and Connections” by Glencoe and McGraw-Hill. The lesson will cover chapter 8: Applying Right Triangles and Trigonometry but will focus on using sine, cosine, and tangent ratios in order to solve/find the sides and angles of a right triangle.

CCSS.Math:

1.) CCSS.Math.G-SRT.6

Understand that by similarity, side ratios in right triangles are properties of the angles in the triangle, leading to definitions of trigonometric ratios for acute angles.

2.) CCSS.Math.G-SRT 7

Explain and use the relationship between the sine and cosine of complementary angles.

3.) CCSS.Math.G-SRT.8

Use trigonometric ratios and the Pythagorean Theorem to solve right triangles in applied problems.

Learning Progression Trigonometry Ratios-1fej0wt


Exponential Decay Functions F.LE

The learning progression will be based upon Exponential Decay Functions where the students will be able to understand the properties and used it to solve real-life problems. At this point, the students have prior knowledge of solving Exponential Growth Functions and will be able to build upon that knowledge and use it to understand how Exponential Decay Functions work. The CCSS.Math standards that are align with the learning progression are:

  1. Math.HSF-LE.A.1: Construct and compare linear, quadratic, and exponential models and solve problems. Distinguish between situations that can be modeled with linear functions and with exponential functions.
  2. Math.HSF-LE.A.2: Construct linear and exponential functions, including arithmetic and geometric sequences, given a graph, a description of a relationship, or two input-output pairs.

3. Math.HSF-LE.B.2: Interpret the parameters in a linear or exponential function in terms of a context.


Learning Progression for Practice edTPA-1lavusr


Statistical Reasoning – S

This learning progression will be taught to a class that consists of juniors and seniors in high school who are currently taking a college course that is taught at their high school, Math 102: Mathematical Decision Making.  The Common Core State Standards (CCSS) that will be addressed come from one domain, High School: Statistics and Probability. The CCSS clusters that will be addressed are “Make inferences and justify conclusion from sample surveys, experiments, and observational studies” and “Use probability to evaluate outcomes of decisions.”  Students will also meet Mathematical Practices 3, 5, and 7.


The central focus of this learning progression is on an introduction to statistical reasoning and the aspects of a study that may produce biased results.  The progression begins with an overview of what statistical studies are and the process that someone must go through to create one.  These foundational concepts will give the background knowledge that they will need to use throughout the remainder of the learning progression.  The students will then learn about some different types of studies and how to avoid bias while creating a study.  In the third task of this progression, the students will use all of these ideas to find their own methods of testing the validity of a study’s results.  At the end of the progression, the students will be asked to design their own study and will work on conducting this study as a project that will be added on to over time.  After completing this learning progression the students will learn how to analyze data and how to represent it graphically to be able to use the results of a study to make decisions with.  The beginning steps of this project will be the students’ assessment.

Learning Progression-Statistical Reasoning-23fwc65

Exponential Growth and Decay Models F.LE.A

Learning Progression edTPA
High School: Algebra with Trigonometry
EXPONENTIAL GROWTH AND DECAY
The class I will be teaching is an algebra class with
trigonometry. The textbook used will be Algebra 2:
Equations, Graphs, applications by Ron Larson, Laurie
Boswell, Timothy D. Kanold, and Lee Stiff, published 2004
by McDougal Littell. This learning progression will follow
the student through meeting the Common Core State
Standards about exponential growth and decay. These
Common Core State Standards will be covered in chapter
8 of the textbook, sections 1 and 2. These sections cover
exponential growth and decay models. That is, to be able
to create an equation, graph it, and solve problems with
exponential models. The standards for these lessons will
cover the cluster involving exponential functions,
including HSF.LE.A.1.C, HSF.LE.A.3, and HSF. LE.B.5. The
math practices that are going to be used throughout the
learning progression are as follows: MP2, MP3 and MP4.
These lessons will span three days. The exponential
growth model lessons will take the first two days and the
exponential decay model lesson will take the third day.
On the fourth day, the students will have a worksheet
with practice problems covering 8.1 and 8.2. This gives
the students a chance to show me how well they are
understanding the material because I will collect the
worksheet at the end of class and will use it to see how
the students are doing. I can assess what they
understand and what I need to cover again.

CCSS.Math.Content.HSF.LE.A.1.C:
which is about modeling exponential
functions and interpreting situations that
need to be solved with an exponential model.
CCSS.Math.Content.HSF.LE.A.3:
Observe using graphs and tables that a
quantity increasing exponentially eventually
exceeds a quantity increasing linearly,
quadratically, or (more generally) as a
polynomial function.
CCSS.Math.Content.HSF.LE.B.5
Interpret the parameters in a linear or
exponential function in terms of a context.
COMMON CORE STATE STANDARDS
MATHEMATICAL PRACTICES
CCSS.Math.Practice.MP2:
Reason abstractly and quantitatively
CCSS.Math.Practice.MP3:
Construct viable arguments and critique the
reasoning of others.
CCSS.Math.Practice.MP4:
Model with mathematics.

Lesson 8.1 Exponential Growth Day 1
This lesson is the first day of a two-day lesson on
exponential growth model. Day-one is an introductory
lesson to the concept. I will start the lesson off by asking the
students what they remember from the prior year about
exponential growth. The students would have been
introduced to the concept in their algebra 1 course with a
very basic overview of the concept. I will then give the
students the equation for exponential growth for them to
get in their notes. The equation is y=bx where b>1 to create
a growth equation. I will tell the students that if the b is less
than 1 this is a decay function which we will get to later in
the chapter. I will also define an asymptote as it relates to
the graph, that is a horizontal asymptote on the x-axis or
y=0. I will then give the students four example problems in
which we will go through graphing together. Once I will as
though the students understand how to graph exponential
growth, I will show them a more complex equation which
includes transformations. They will now have the equation
y=abx-h+k where a represents stretching and shrinking, h is
the shift left or right and k is the shift up and down. I will
then give the students one equation to graph on their own
using transformations.
After we have completed the notes for this section, I will
move to a class activity. I will post graph paper sticky notes
on the front board with exponential equations on the top of
each paper. The students will come to the front of the class
and pick a sticky note and graph it individually, which is
modeling or MP4. They will put their names on the back and
post them back on the board when they are finished. They
will then look over other answers that have been posted. If
the students have and questions or comments, they can
look at the name on the back and find the person to discuss
the answer. The students will then have to explain their
answer and their thinking which will create great
conversations about the concepts, thus using MP3 in this
activity.

Learning Targets:
I know about the exponential growth
model.
I can graph exponential growth
equations
Common Core State Standard:
CCSS.Math.Content.HSF.LE.A.1.C:
which is about modeling exponential
functions and interpreting situations
that need to be solved with an
exponential model.
CCSS.Math.Content.HSF.LE.A.3:
Observe using graphs and tables that a
quantity increasing exponentially
eventually exceeds a quantity increasing
linearly, quadratically, or (more
generally) as a polynomial function.
CCSS.Math.Practice.MP3:
Construct viable arguments and critique
the reasoning of others.
CCSS.Math.Practice.MP4:
Model with mathematics.

Lesson 8.1 Exponential Growth Models Day 2
This lesson is the second day of exponential growth model.
On day two, we will be working with applying the growth
model to word problems. I will be giving the students a new
formula they can use for application problems to create a
function as it relates to each word problem. The new growth
model is y=a(1+r)t where a is the initial amount, r is the
growth percentage as a decimal, t is the time, and y is the
end amount. I will also explain to the students that the
quantity (1+r) is known as the growth factor. After discussing
these notes, we will move to example problems to apply the
concepts. I will give the students a word problem and have
them tell me what information goes where in the formula.
Then once we have created a function, I will have them
graph it and have them solve for an end amount after a
given time. We will do this again with another problem to
practice. I will then ask the students how they are feeling
about the material by giving me a thumbs-up, thumbs-down,
or thumbs-sideways depending on how they feel. If the
students still seem to struggle with the concept, we will go
over another problem. If the students are understanding the
concepts then we will move to an activity.
For the activity for this lesson, I will write five different
exponential growth model functions on the board. The students
will choose one then graph the function and create a real-world
problem from the equation. The students will need to come up
with a scenario that will match the function. This will use MP4 for
the graphing and modeling and MP2 for reasoning abstractly and
creating a scenario from the equation. Once the students have
their scenario, they will share their word problem with their
neighbor and the neighbor must guess which function matches
the scenario. For example, student 1 and student 2 are paired up.
The students swap scenarios with the function covered or hidden.
Student 1 must guess which function student 2 choose and
explain their thinking, then they will repeat this with student 1’s
scenario. If either of them gets it wrong, they must guess again.
This gives the students a chance to show their understanding or
where they struggle. The students can help each other verify if
their answers are right and create great mathematic
conversations about exponential growth models.

Learning Targets:
I know about the exponential growth
model.
I can use the model to solve application
problems.
Common Core State Standard:
CCSS.Math.Content.HSF.LE.A.1.C:
which is about modeling exponential
functions and interpreting situations
that need to be solved with an
exponential model.
CCSS.Math.Content.HSF.LE.B.5
Interpret the parameters in a linear or
exponential function in terms of a
context.
CCSS.Math.Practice.MP2:
Reason abstractly and quantitatively
CCSS.Math.Practice.MP4:
Model with mathematics.

Lesson 8.2 Exponential Decay
For the final lesson in this learning progression, we will be
covering exponential decay. I will remind the students about
when I briefly mentioned how decay relates to growth on
the first day. I will ask the students to remind me of the
exponential function we used on the first day with the
transformations, which is y=ab(x-h)+k. I will then ask the
students to define each term in their own words. This gives
me a chance to assess whether or not the students were
taking notes and understanding the material. By having
them put it in their own words, it forces the students to
show an understanding of the concept rather than just
reading from their notes. I will also remind them that for the
function to be a decay model rather than a growth model,
the b value must be between 0 and 1. If the b value is above
1, we will have an exponential growth model. I will also
discuss the long term for the graph, as the t value gets large,
then the end amount or y value will get closer and closer to
zero but will never be zero, therefore having an asymptote
at y=0 or the x-axis. As long as the students do not have any
questions about this equation, we will move onto doing
some practice problems of graphing three different
functions with the same b value of ½ but each has different
transformations.
Once we are done graphing each example, I will ask the
students to remind me of the exponential growth model
they had learned the day before, which was y=a(1+r)t. For
decay the equation is nearly the same except the growth
factor is now a decay factor and is 1-r instead of 1+r,
therefore making the quantity less than 1. All the terms are
the same as in the growth model, however the r value is
now a decay rate as a decimal instead of a growth rate.
Thus, the decay model being y=a(1-r)t.
After comparing the growth model to the decay model, I will
give the students a class activity. I will give the students a
word problem to apply the decay model to. This will be a
three-part problem where they will write the decay model
based on the problem, then graph the model, and finally solve for the end value after 3 years.
Students will work on this individually then discuss it with their neighbor once most people are
done. Once everybody seems to be done discussing the problem, I will give them the answer to
the end value after three years to check their work. If they got this correct then their decay
model should be correct and they should be able to find this point on their graph is they look at
what the value of y is when x is 3. This allows the students to check their work without me
going over each part and giving them all the answers.

Learning Targets:
I can graph the exponential decay
function.
I can solve problems using the
exponential decay functions.
Common Core State Standard:
CCSS.Math.Content.HSF.LE.A.1.C:
which is about modeling exponential
functions and interpreting situations
that need to be solved with an
exponential model.
CCSS.Math.Content.HSF.LE.A.3:
Observe using graphs and tables that a
quantity increasing exponentially
eventually exceeds a quantity increasing
linearly, quadratically, or (more
generally) as a polynomial function.
CCSS.Math.Content.HSF.LE.B.5
Interpret the parameters in a linear or
exponential function in terms of a
context.
CCSS.Math.Practice.MP3:
Construct viable arguments and critique
the reasoning of others.
CCSS.Math.Practice.MP4:
Model with mathematics.