Are we any closer to equality than we were in 1963?
Content and Practice Standards:
CCSS.Math: 8.F.B.4
CCSS.Math: 8.F.B.5
MP 4 – Model with mathematics.
Central Focus and Purpose:
Through experiment in mathematics and culture we will explore data in a series of graphs and evaluate whether we as a society are any closer to equality in the time that has passed. Students create models of linear functions and learn to recognize nonlinear function. They will find the slope of a linear function and evaluate what it means in terms of the economic, education, and social data in the interactive activity to determine whether we are any closer to equality.
Targets and Plan for Intended Learning:
Students will be able to calculate the rate of change and use the rate of change to interpret data in real-life graphs. Students will also be able to estimate a linear function over top of a graph that may not be perfectly linear.
Materials and Technology Needs:
For this assignment we will be using the classroom computer and projector to view short videos as well as read an article as a class. Worksheets for every student to complete (plus a few additional), calculators, pencil, and erasers. Students will be able to use the graphing calculator with the help of the teacher to find a line of best fit when appropriate to check their models.
Assessment Strategies:
- The teacher will observe groups and look for possible student misconceptions to assure students are understanding what a linear function is and how to find the slope and ensure there are no problems caused by students making assumptions.
- Help students with defining their variables correctly and answering the questions asked of them.
- The teacher will ask groups to present their ideas and interpretations of the data. Other groups will be asked to comment and make connections to the material. Students must demonstrate they constructed a linear equation, and solve for the slope of the line.
- Formative assessment will be the teacher’s evaluation of the written responses that are submitted at the end of class as well as their observations during the assignment. Students must show critical thinking and math reasoning. They must show a linear equation and evaluation of the line for its slope.
Relevant Multimedia Links:
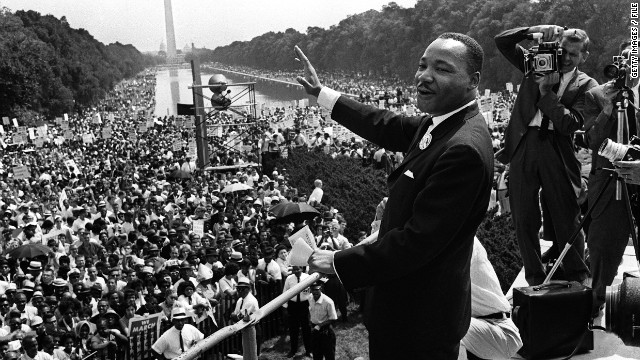
A Half-Century After the March on Washington, Would King Be Satisfied? (Article).
“I have a dream” Martin Luther King Jr. the March on Washington (Short Version YouTube).
Graphical slope of a line | Linear equations and functions (Instructional Material YouTube).
Graph Shop – Graphing Lines Thrift Shop Parody (YouTube).
Lesson Plan and Materials: