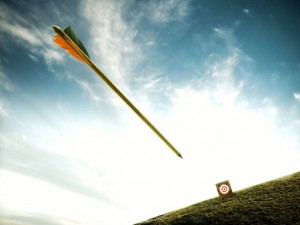
 Archery is considered to be one of the oldest sports in the world. Bows and arrows have been being used for hunting and for sport for over 25,000 years. So when trying to think of a way to incorporate the real world into a mathematics lesson, I thought what better way than to use archery to help students hit their learning target (pun intended). The unique flight of each arrow, not to mention the archer’s paradox, provides a math teacher many options when it comes to applying math to archery. Not only does archery have many connections to math, but it is something that a lot of the students are interested in. As the archery director at a summer camp, I had campers begging me to spend more time at the archery range. Even in my field experience classroom, at least 50% of my students are hunters and are constantly telling each other hunting stories.
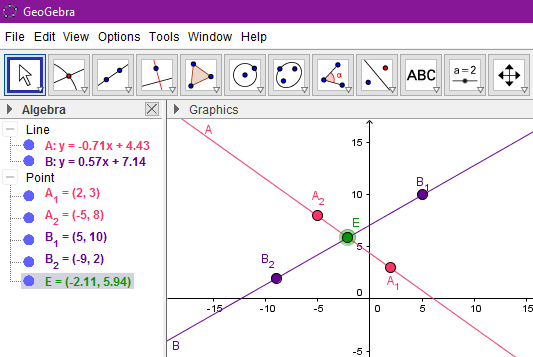
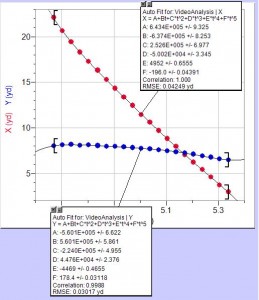
Recent advances in technology makes analyzing arrow flight simple and fun. The Logger Pro software by Vernier allows students to take a small clip of them shooting an arrow and analyze it frame by frame and to perform statistical analysis of the data. The students will be able to find the velocity of the arrow as it leaves the bow and compare it with the velocity of the arrow as it hits the target. This will hopefully spark a conversation about air resistance and other real-world factors that will affect mathematical predictions. Students will also be able to track the flight of the arrow and find the function that best fits that flight. No matter what type of function you choose, Logger Pro will come up with the constant multipliers for that function that best fits the flight of the arrow. This can open a discussion about margin of error.
Activity
Materials needed:
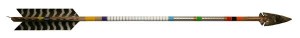
- Recurve or Longbow
- Flu Flu arrows (preferably with yellow fletching)
- Computers with Logger Pro software
- Targets
- Phone with video capabilities or camera
- Worksheet
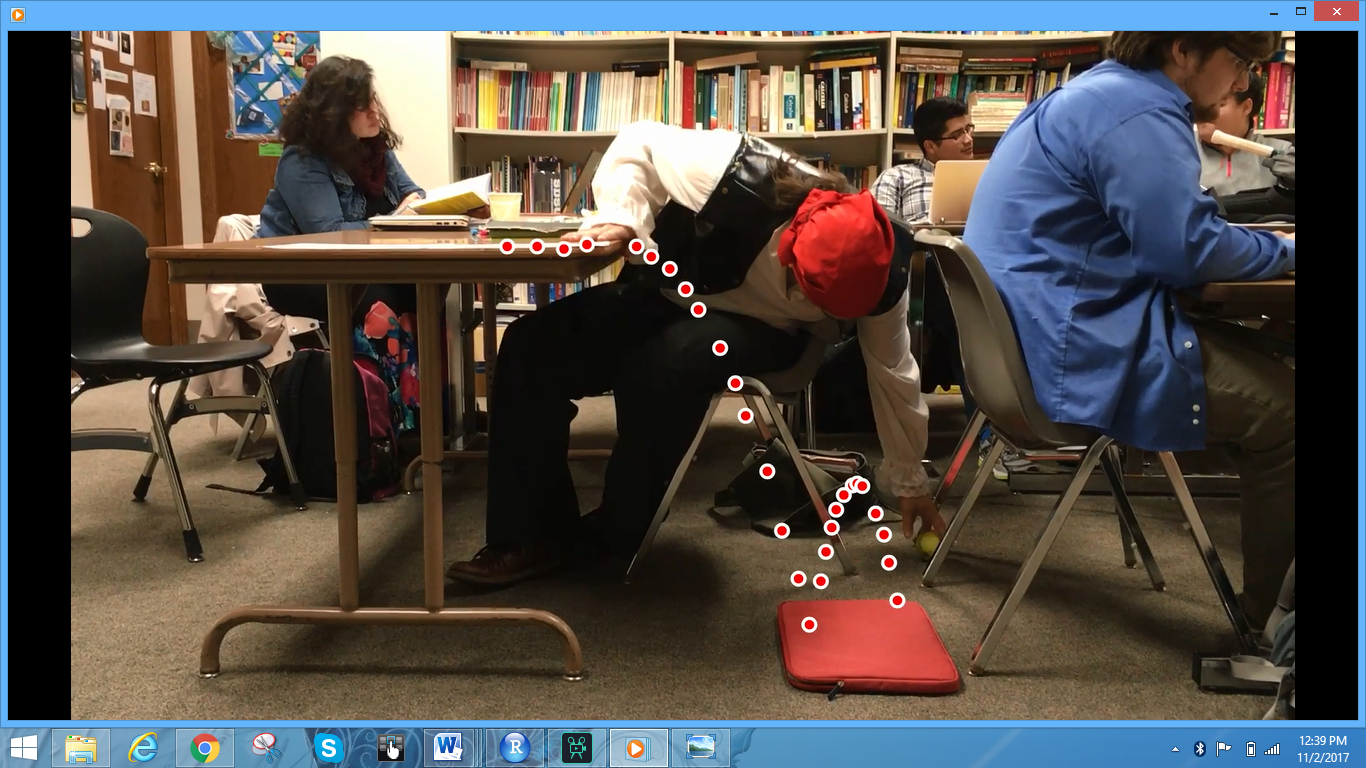
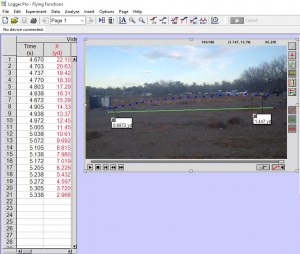
First, I will have the students take a guess at how quick they think that the arrow is flying. I will discuss with them that, in archery, speed (velocity) is commonly described by feet per second. We will have a short review about how when something is moving only forward, speed and velocity are the same thing. I will then have the students convert their feet per second guess into miles per hour and yards per hour. I will also have the students guess which type of function would best model the flight of an arrow. I will not require them to come up with an exact function, that is, they will not need to guess constants, but I am looking for an answer of linear, quadratic, exponential, cubic, quartic, quantic, etc. After the students have made their predications, we will go out to the football field and set up the targets. This is when I will teach them about safety and proper shooting form and they will be able to take a couple practice shots. By teaching them about safety, I am preparing students to be responsible citizens and archers. It’s up to the teacher how far away they want the students to shoot from. The farther away, the more curve you will see in the arrow. However, the farther away you are the less likely you are to see the arrow fly. I suggest shooting from about 20-30 yards. The students will take turns shooting and for safety reasons, I will be the one to take the video. All other students should be behind the shooting line. The videos will look similar to the one below.
IMG_1822
When the students analyze the speed on Logger Pro, they will realize that the initial speed of the arrow is going to be faster than the speed of the arrow as it hits the target. In my example, the arrow was initially going 43.848 yards/sec and then as it hit the target it was going 20.823 yards/sec. The students answers will initially be in yards/sec form and then I want them to convert it to feet/sec and then to miles/hour. I will then ask the students why they think the arrow slows down. Next, the students will analyze the video by graphing points on the actual video using Logger Pro. The students will then be able to compare the function they predicted to the function that Logger Pro says best fits their arrow flight. Note: you will probably have to teach the students how to use Logger Pro prior to this activity.
Barriers to Implementation/Adaptations
Since archery can be considered a dangerous sport, a teacher must be certified in order for students to be allowed to shoot archery on school grounds. There is an organization called National Archery in the Schools Program (NASP) which certifies teachers to be able to do just that. Typically, PE teachers are the ones that are certified; however, anyone is able to be certified and certification does not expire. I personally am certified so with support from a principle I would be able to implement this activity using real bows and arrows. If you’re not certified and have no desire to get certified, you can see if the PE teacher at your school is certified and if they are interested in supervising. If there is no way to have anyone certified present, you could also do this activity with a cheap nerf gun or have the students create a small homemade bow out of pencils and rubber bands. You could even shoot one video yourself on your own time and then have all the students analyze the same video instead of shooting their own. This activity could even be done with the flight of any other items, basketballs, baseballs, shoes, javelins, etc. So you do not necessarily have to do this activity with an arrow.
Parental and Community Involvement
My hope is that the students will be so excited about having shot arrows during math class that they will go home and tell their families all about it, thus, involving their families. Part of my reason for having the students convert their guesses and the actual speed of the arrow into miles per hour is so that the general community would understand the units with which they were talking about. Aside from archers, I’m not sure who commonly refers to distance in only yards and refers to speed in feet/sec. I want the students to not only be able to make the conversion but also be able to discuss the activity with others. Also, I will definitely be alerting the parents prior to this activity that the students will be shooting arrows during class. Even though flu flu arrows are not very dangerous at all in comparison to regular arrows, I still want the parents to be aware and involved. Hopefully, by letting the parents know that this activity is going to happen, they will be eager to ask their child about the activity and the student will be able to share with them.
The hunting and archer community is very unique in that, if you are a fellow archer or hunter, you’re almost automatically friends. People in this community love talking and telling each other stories, sometimes for hours upon end. By having the students shoot a couple arrows during class, I am supplying the students with stories and an experience that they will be able to contribute to the conversations if they are ever around other archers.
This activity aligns with the following common core state standards.
CCSS.MATH.CONTENT.HSN.Q.A.1
Use units as a way to understand problems and to guide the solution of multi-step problems; choose and interpret units consistently in formulas; choose and interpret the scale and the origin in graphs and data displays.
CCSS.MATH.CONTENT.HSA.CED.A.1 Create equations and inequalities in one variable and use them to solve problems. Include equations arising from linear and quadratic functions, and simple rational and exponential functions.
You can download the free demo version of Logger Pro at http://www.vernier.com/downloads/logger-pro-demo/
Worksheet:Flying Function worksheet
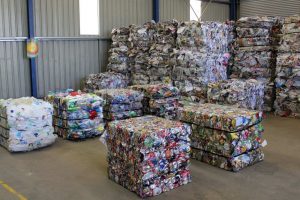
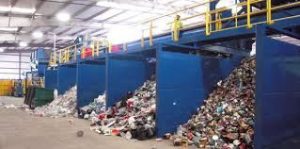 These three pictures show three steps of the recycling process of plastic containers. This process begins with many different containers being stored together because they are made out of plastic. Then the containers are loaded into a machine that compresses them together so that when they come out of the machine they hold a uniform shape. I would use this process to help students conceptualize functions. The storage of the many different containers represents a function’s
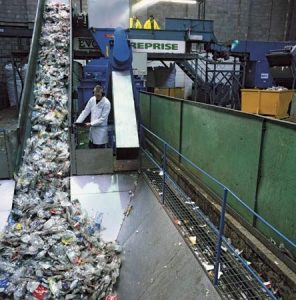 domain, the compacting machine represents the function itself, and the compressed and uniform cubes of plastic containers represent the function’s range and the organization of the ordered pairs that are produced by the domain and range. By including this analogy in your lesson, students will all have at least one real world occurrence that they can use as they reason through the concept of a function.