This learning progression is made to take place in a high school Algebra classroom of 25 students. This class consists of freshman and sophomores. The desks in the classroom are arranged in groups of four. The lesson is based off the Algebra I textbook. The students have prior knowledge of binomials and what they look like and prior knowledge on the GCF.
learning progression-tt6ir7
Assessment of CCSS-Math
Discussion the summative and formative assessment of 5-11 grade of assessment of CCSS-Math.
Systems of Inequalities Assessment A.REI.D
System of inequalities (CCSS.Math.Content.HSA.REI.D.12)
Alignment to Content Standards
Alignment: CCSS.Math.Content.HSA.REI.D.12
Alignment: CCSS.Math.Content.HSA.REI.D.10
Tasks
Find the system of inequalities for the graph below. Write the inequalities in slope-intercept form.
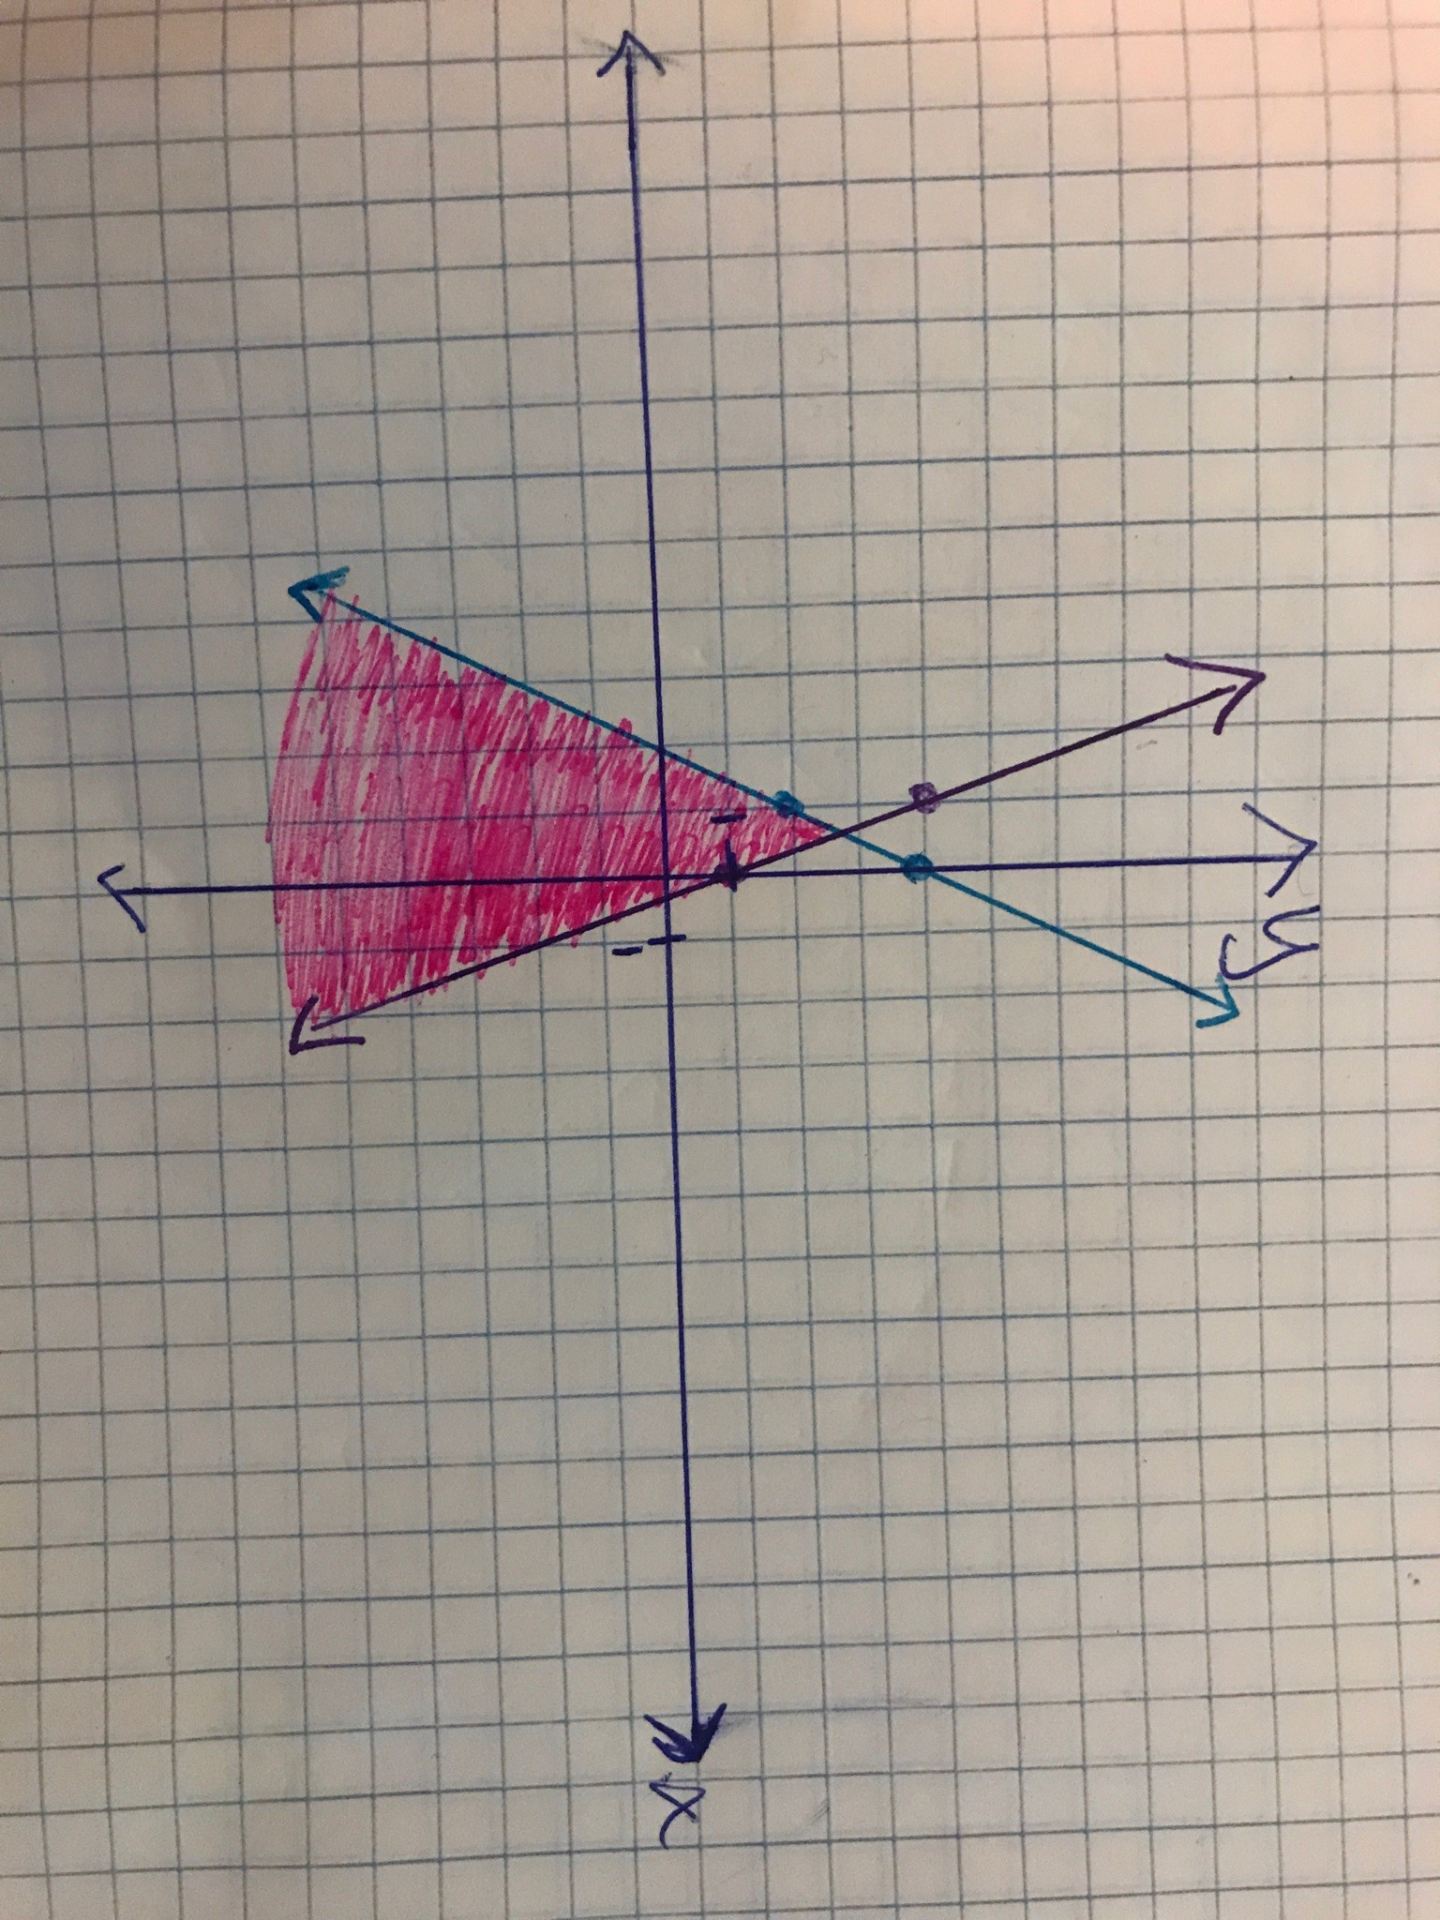
Then, determine if the following points are in the solution set of the system of inequalities:
(0,0), (1,1), (-1,1).
Commentary
The purpose of this assignment is to assess whether the students understand systems of linear inequalities and the solution set. In this task, the students will be working with two major skills. They will be creating equations for two inequalities in two variables for a system of equations from a graph. The students will also be determining if a point satisfies the solution set from the system of inequalities. The students will have to have a full understanding of the concept to be able to complete this assessment since the students are given the solution and must work backward to find the system that satisfies the solution.
Solution
The first step to completing this assignment, the students must first create inequality equations for each line. Since the assignment says the equations must be in slope-intercept form, the student can use the plotted points to calculate the slope and find the y-intercept for each then create the formula for the equation. They must then choose a point in the solution set, that is the shaded region, and plug that into their equations and choose the correct inequality symbol to create a true statement.
For the purple line, the slope is -3 and the y-intercept is 1; therefore, the equation for the line is y=-3x+1. Then by putting a point into the equation that is in the solution region and simplifying, we can find the correct inequality symbol. For this one I put in the origin point, (0,0) and simplified.
0 ? -3*0 + 1
0 ? 1, 0 ≤ 1
Therefore, the inequality should read y ≤ -3x + 1. The inequality has the equal to part since the line is a solid line and not a dashed line. If it was dashed then the symbol would only be less then, <.
For the blue line, the slope is 2 and the y-intercept is 4; hence, the equation for the line is y=2x+4. Similarly to the purple line, by putting in the origin, (0,0), which is a point in the solution shaded region, we can find which inequality symbol to use.
0 ? 2*0 + 4
0 ? 4, 0 ≤ 4
Thus, inequality is y ≤ 2x + 4. Again, since this line is solid the symbol contains the equal to part as well as the less then, <.
Finally, the student need to determine if the three points are in the systems solution set or not. The students can do this in two different ways. They can either look on the graph and see if the point is in the shaded region then it is in the solution set. Or the students can put the point into both equations and see if the statement is true for both inequalities. If the point creates a true statement for both, then the point is in the systems solution set. Therefore, (0,0) and (-1,1) are in the systems solution set and (1,1) is not.
Find the Percentage and Angle of Each Subject A.SSE.B.3
Assessment Task
A survey of 10th grade students was given to determine what their favorite subject is. Use the first graph and find the percentage of students that chose the subject as their favorite. Round the nearest hundredth. (.344=34% or .345=35%). Use that information, with previous knowledge about a circle, and find the central angle that each percent represents in the pie chart.
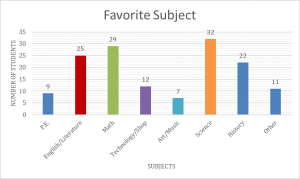
- Use this pie chart to label percentages and angles of each piece. (Hint: the pie graph is 360°).

- After finding the percentage and the angle of each subject, write it as a single proportion and solve for the measure of the central angle. The answer should be in degrees.
Find the Percentage and Angle of Each Subject Document with Commentary and Solutions (Here)
Surface Area & Volume of 3D shapes 6.G.A.4
6.G.A.4: Solve real-world and mathematical problems involving area, surface area, and volume.
Tasks: Students will have to properly use the equations provided in order to calculate the surface area and volume of the following shapes.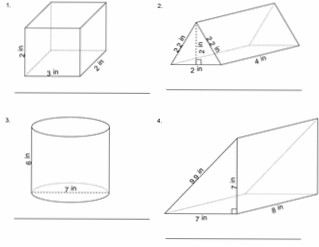
When calculating the surface area of an object (examples 1, 2, and 4) how many faces are there in order to get the right answer?
Commentary
The goal of this task is for students to understand the concepts behind 3D shapes and have a visual representation of shapes. During the lesson is taken place, the teacher will require to show students how to properly label the parts of the shape in order to correctly use the information in the equations provided to them. This will allow the students to understand the different dimensions and sides of a shape. Once the students are able make connections, the students will be able to determine the surface are and volume of a shape. With this being said, it’s common that students make simple mistakes such as forgetting to add the right number of faces of a shape. At this point, the teacher will need to use this task to make sure that students are able to understand the dimensions of a figure and how they differ from a different shape. The teacher will provide the properties and cover example problems in order to calculate the surface are of the shapes and volume. The students will also have a visual representation of the shapes.
Solution:
- By looking at the shape, we can see that there are four faces/sides with the same dimension of 3×2. This implies that the dimension of 3×2 will be multiply by 4 or simply add (3×2=6) 4 times. This will result of 24 in². The remain 2 faces/sides have a dimension of 2×2 resulting in 8 in². To a total surface are of 32 in².In order to calculate the volume of the figure (Length x width x height) we get 2in * 3in * 2in = 12 in³.
- To calculate the surface area of this shape, the same procedure as solution 1 will be follow with the exception that in order to calculate the surface area of triangle will require the equation of (base*height)/2. To a total surface area of 29.6 in². In order to calculate the volume of shape the picture on the right illustrate the equation needed to do so and volume = 8 in³.

- In order to calculate the volume of a cylinder the picture on the left illustrate how to do it. The volume of the shape will be 230.91 in³. To calculate the surface area of the cylinder, it will require students to use the equation. Surface area = 209 in².
- In order to calculate the surface area, we can see that the shape has a right triangle and two of the faces make up a square resulting in 49 in². By adding to other 3 sides/faces we get a total of 240.2 in². To calculate the volume of the figure the equation of Volume = area of base x height will be needed. This indicates that area of the base is (7*7)/2 and the height is 8 in where the volume = 196 in³.

Create your own story using double variable equations F.LE.5
Alignment to Content Standards
CCSS.Math.HS.F-LE.5
Interpret the parameters in a linear or exponential function in terms of a context.
Tasks
Students will be given the equation y=2x-10. Their job is to write a story that goes along with this equation. This story will include:
-A word problem that is equivalent to y=2x-10
-Questions that follow up the word problem (with answers).
-A picture/graph that narrates the answer.
Students will share their story with a peer and have the peer solve their story problem.
Commentary
Its common for students panic when trying to solve story problems and not think about the procedures that relate to the words in the problem. Therefore, I am going to challenge my algebra 1 students to create their own word problems to match a specific equation. This will require planning to make sure their parameters work out correctly. Plus they will have to think of a creative way as to how mathematics applies to the real world.
Solution
There will be MANY solutions to this problem. One solution could be:
Story: Sarah is running up the stairs in her house to get to the living room. She is 10 stairs below her living room. She can run up the stairs at a rate of two stairs per second. How long will it take Sarah to get to the living room?
Equation: y=2t-10
Parameters: y=how many stairs Sarah has climbed & t=how many seconds Sarah is running.
Answer: 0=2t-10 thus t=5. It will take Sarah 5 seconds to climb 10 stairs.
Picture: (include a graph of the function y=2x-10 and a picture of the scenario)
Evaluating Functions in a Context: CCSS.Math.Content.HSF.IF.A.2
Assessment Task:
Basketball Jerseys
The basketball coach at Cashmere High School is planning on buying new jerseys for his team. There is an initial design fee of 500 dollars plus a fee of 110 dollars per jersey. The total cost of n jerseys can be written as the function
C(n)=500+110n
- Find C(16). Explain in words what this solution means.
- Find C(20). Explain in words what this solution means.
- If the coach has a budget of $2,000, how many jerseys can he afford?
- The coach then went to a different brand to check their jersey prices. They told him there is a design fee of $200 and each jersey is an additional $150. Write a new function, F(n), that represents the total price of these jerseys.
An assessment commentary and the solutions for this task can be found in the attached document.
Finding height using trig ratios SRT.C.8
Title (primary CCSS Math with Title)
CCSS.MATH.CONTENT.HSG-SRT.C.8.
- Similarity, Right Triangles, & Trigonometry
Alignment to Content Standards
Define trigonometric ratios and solve problems involving right triangles
Use trigonometric ratios and Pythagorean Theorem to solve right triangles in applied problems.
Task
Word Problem:
Isabel just planted a new tree and attaches a guy wire to help support the tree while its roots take hold. A 6-foot wire is attached to the tree and to a pole in the ground. From the pole in the ground the angle of elevation of the connection with the tree is 52º. Find to the nearest tenth of a foot, the height of the connection point on the tree. Use the diagram below to help model the problem. Label diagram if desired.

Figure 1
Commentary
The purpose of this task is so students can apply their combination of skills of similar triangles, ratios, right triangle trigonometry and their knowledge on the Pythagorean theorem to solve problems in mathematics related to real life scenarios.
Solution
The “angle of elevation” is from the ground up.
It is supposed that the tree is vertical which makes it perpendicular with the ground.
This problem is a sine problem since it involves opposite and hypotenuse.
sin52°=h/6; 6sin52°=h; h≈4.7 feet
What is a root of a quadratic equation? A.APR
CCSS.MATH.CONTENT.HSA.APR.B.3
Identify zeros of polynomials when suitable factorizations are available, and use the zeros to construct a rough graph of the function defined by the polynomial.
CCSS.MATH.PRACTICE.MP4 Model with mathematics.
Task:
A ball is thrown up into the air at 6 feet per second from the ground. At what point will the ball come back down and hit the ground? (Hint: use 16 to represent gravity) Write out all of your steps used in solving and graph the ball’s motion.
Commentary:
Learning how to use quadratics and how to find their roots can be very confusing to students at first. When the vocabulary words roots and zeros of quadratic functions are first introduced students often do not create their own visualization of what these terms mean. Students also do not realize that these words are interchangeable or what the purpose of finding them is. This task gives them the opportunity to see one application of a quadratic function and also gives students the chance to visualize what the roots of a quadratic actually are. Teachers may use this task while teaching students about the zeroes of polynomials and to show students how to model using mathematics. This task should be given to students after they have been introduced to the methods used in finding the roots of a quadratic function. This task is designed to give students a tangible scenario that will help them meet the common core standards.
Solution:
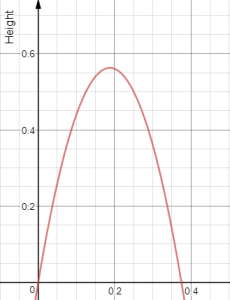
B (t) = -16t^2+6t
0 = t (-16t + 6) Factor out a t from both terms and set equal to 0 to find the zeros of the function.
0=t, = t To find the t values, set each factor equal to zero and solve for t
After (6/16) seconds the ball will fall back down and hit the ground.
G-SRT.6 Special Right Triangles
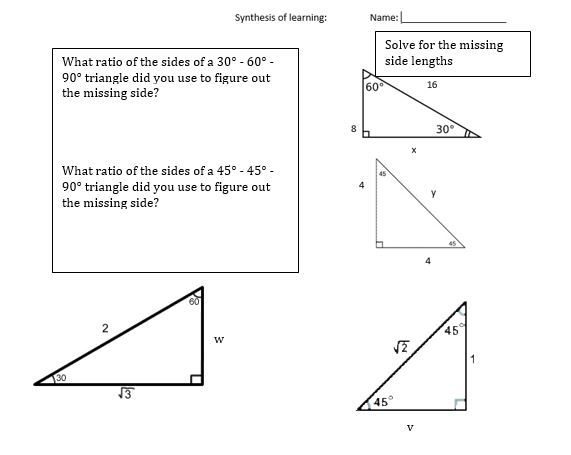
The assessment commentary and solution is on the attached document: Special Right Triangle Assessment Task
Finding Properties of Scale Factor G-SRT.1
Assessment Task:
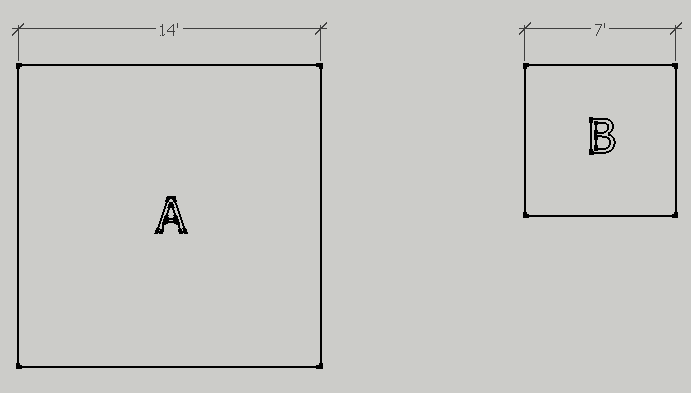
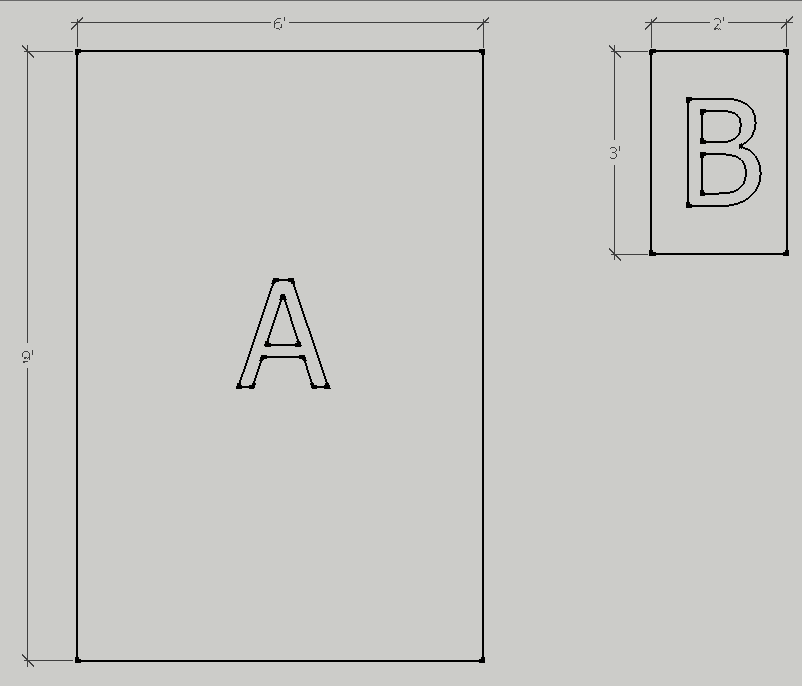
Solve the following problems based on the pictures given. You may use a calculator. Show work and answers on separate piece of paper. Use units when appropriate.
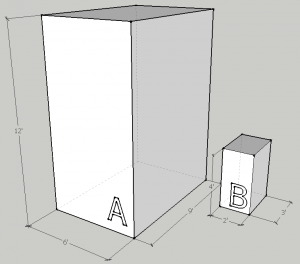
- What scale factor makes the sides of B equal the sides of A?
- What scale factor makes the area of B equal the area of A?

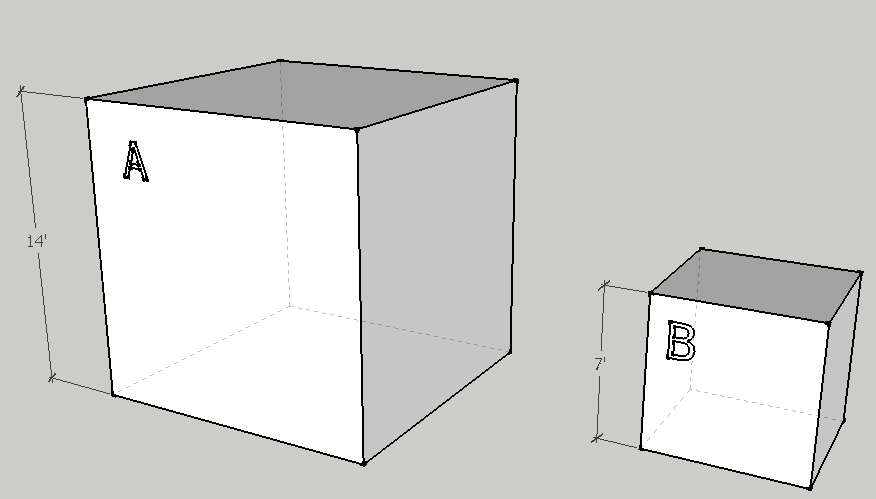
- The squares are now cubes. What scale factor makes the volume of B equal the volume of A?

- What is the relationship do you see between the scale factors of side length, area, and volume? Describe that relationship as a ratio and in words. Do you think this will always work? Why?


Finding Properties of Scale Factor Task, Commentary, and Solutions
CCSS.Math.HS.G-SRT.1 “Verify experimentally the properties of dilation given by a center and a scale factor”