Shape Sorter 6.SP.B

By Rachel Van Kopp, Kimberly Younger, Tracy Van Lone, Natasha Smith, and Naomi Johnson
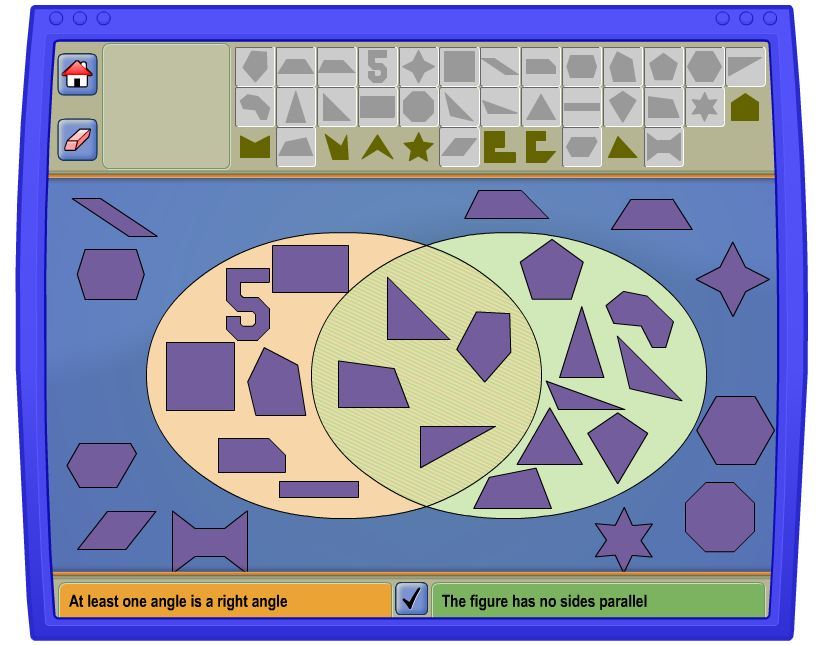
CCSS.MATH.CONTENT.7.G.A.3In the NCTM shape sorter activity, students use aVenn diagram to understand concepts of sorting geometric shapes by categories. For this activity our group of pre-service teachers sorted figures based on these parameters: 1. the figure has rotational symmetry and 2. the figure has at least one line of symmetry. Our group came up with two rules that we found to be true:

  1. All regular polygons have at least one line of symmetry
  2. All parallelograms  have rotational symmetry, but not a line of symmetry with the exception of the rectangle.

The following images are examples of attempts our group has made with the given categories.


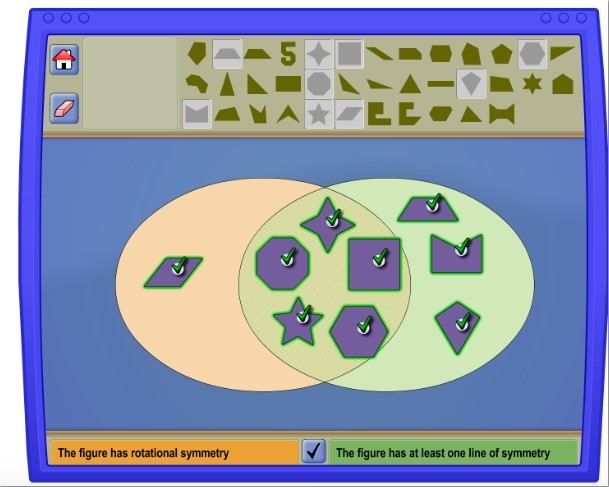
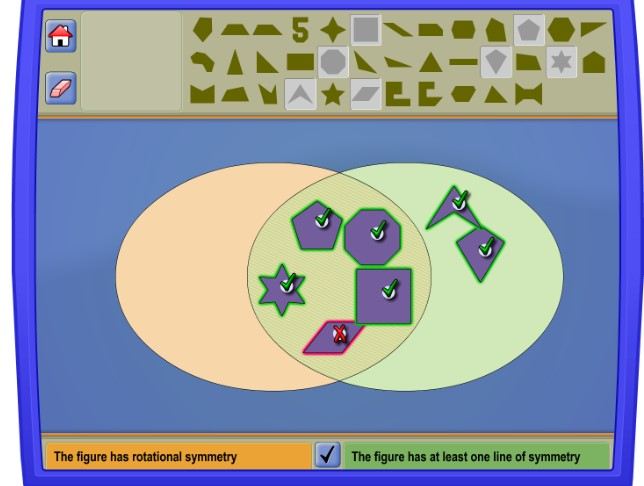
Common misconceptions: Some common misconceptions with the categories has one line of symmetry and has rotational symmetry is that parallelograms have a line of symmetry. This is actually not true because no matter where the line is drawn on every parallelogram, except a regular trapezoid and rectangles, the angles will be off-set. Another misconception is that all figures with rotational symmetry have a line of symmetry. This is also untrue because parallelograms have rotational symmetry, but no line of symmetry.

To bring this activity in the classroom, we created a lesson warm-up and the worksheet pictured below, which can be download here. The warm-up (which is available via the link but not pictured) focuses students on relevant geometric vocabulary, and the worksheet serves as an activity tracker, helping students make connections between geometric concepts and sets and logic learning via their activity on the NCTM Shape-Sorter app.


Shape Sorter CCSS.Math.Content.6.SP.B.5.b

As students learn to classify shapes based on characteristics such as the length of the sides or the size of the angle, Venn Diagrams become effective tools. Illuminations, by NCTM, offers an easy to use online application for visually sorting polygons.  The app allows the user to pick one or two characteristics to sort polygons by, ranging from angle measures to side lengths and parallelism to symmetry.

After selecting one or two rules on the application, students then have the opportunity to shape pre-determined shapes into the correct category. The app has a “check your work” function (the check mark in the middle of the screen, see figure) that allows students to double check a shape if they are unsure of the answer. This ensures students have the correct understanding of vocabulary terms, such as what parallel lines or right angles are, as well as refining their understanding of complex statements such as “one or more” and “at least one”.

The application also offers a unique perspective for the student. Too often students learn the basic form for regular polygons, and rarely see variations. This resource has a number of polygons in irregular form that will help the students identify the variations. In addition, having a visual display of the different sets allows the student to contrast and compare the different shapes that apply to certain rules. This becomes an excellent opportunity for the student to identify patterns or additional properties that may be present among the shape. For example, in the shared image above a possible observation a student could reach may be “a 3-sided polygon will never have parallel sides”, or “the number of sides a polygon has is the same as the number of angles.”

Valentines Day Candy! CCSS. Math.Content.7.SP.C

Photo Credit

Learning Objective: I can collect the probability of sweetheart candies; colors or sayings by making collecting data and determine the frequency.

With Valentines Day fast approaching, students can take advantage and do math with candies. In this activity students can use regular 1 oz boxes to determine the frequency of each colored heart, or of each saying. Students can connect math with candy, of course all students enjoy candies! When students are making connections with what is relevant to them, than they are able to retain information better. Students can start out by predicting the number of candies in each box. After students predict they can have a small classroom discussion by sharing their predictions. Students can also share which color or saying in the box is their favorite. When students are are finished having their discussion they can individually count and graph data. To extend this activity students will use their data that they found with their class and determine the average in terms of color or saying. Students can also write down fractions to describe their candy color or saying as a fraction of the total.

To extend this activity Sweetheart candies can be bought in different languages. For example the picture above says “cutie pie”, but instead candies can be purchased to have Spanish sayings instead. Students can become familiar with a different language and incorporate what other countries do to celebrate this holiday.

CCSS.Math.Content.7.SP.C.6

Approximate the probability of a chance event by collecting data on the chance process that produces it and observing its long-run relative frequency, and predict the approximate relative frequency given the probability. For example, when rolling a number cube 600 times, predict that a 3 or 6 would be rolled roughly 200 times, but probably not exactly 200 times.

CCSS.MATH.PRACTICE.MP1 Make sense of problems and persevere in solving them.

CCSS.MATH.PRACTICE.MP4 Model with mathematics.

Count the Rainbow CCSS.Math.Content.7.SP.C.6

Learning Objective: I can collect the probability of Skittle colors and determine a relative frequency.

This is a real world application problem connecting probability in a context students enjoy and understand, candy! This activity allows students to evaluate a regular sized packet of Skittles by determining the frequency of each flavor. Everyone has a favorite Skittle, whether it is the cheery red or the new green apple green. This way students can evaluate how frequent their favorite colored Skittle is in typical packet of Skittles. As students participate in this activity they are connecting aspects of mathematics into a context problem that appeal to their lives. When students relate mathematics to real life situations they are able to connect its importance. Then, students can participate in a mathematical discussion to reason abstractly about the probability of different colored Skittles to determine the relative frequency found in all bags. As they discuss the problem students will be making sense of problems. When the students discuss the frequency and probability of skittles in the bag, they can relate it to the production of Skittles, which opens a discussion where students participate as responsible citizens by gaining further knowledge.

As students investigate the frequency of skittle flavors in their designated bags, they can create different representations to demonstrate the date. These representations can be frequency tables, frequency graphs, pictograph, histograms, line graph, bar graph, etc. As they apply these different representations the Skittle problem they are practicing areas of mathematics. Also, students can then relate the information to their classmates and discover patters to determine the relative frequency of Skittle flavors.

CCSS.Math.Content.7.SP.C.6
Approximate the probability of a chance event by collecting data on the chance process that produces it and observing its long-run relative frequency, and predict the approximate relative frequency given the probability. For example, when rolling a number cube 600 times, predict that a 3 or 6 would be rolled roughly 200 times, but probably not exactly 200 times.

CCSS.Math.Practice.MP1 Make sense of problems and persevere in solving them.

CCSS.Math.Practice.MP2 Reason abstractly and quantitatively.


School Presidential Election 7.SP.A

School Presidential Elections

The students are learning about probabilities in math so they will apply these concepts to a real life event that happens every year in schools across our nation.This sample picture has so much meaning to all the students in the entire 7th grade class as it is about school culture. There is a number of probability activities this simple picture can expand to using mathematical practices as to who will win the election. Activities like: Will it be a girl or boy? Will it be the popular student or the student that delivers the best speech? Based on a mini session of class voting, will it be an accurate representation of the actual event?  For this particular activity there is a total of 6 students in the running for class president, 2 boys and 4 girls. The students will use red poker chips for the girls and blue poker chips for the boys as well as a randomization holder (paper bag). This process will help determine whether a girl or boy will be president based on some fun probability activities (SEE HANDOUT ATTACHMENT). The students will also explain as to what parts of the activity are empirical or theoretical and why as well as learn the Law of Large Numbers. This activity aligns with CCSS.MATH.CONTENT.7.SP.A.1 & 2

PictureProblemActivity

What’s the Probability HSS.MD.B.5.&7.

After introducing a new topic in mathematics, students find it difficult to take what they have learned into practice. However, keeping students interested, active, and engaged in different activities makes a significant difference in their learning experience.

Students will come up with measures of chance. One of the questions that they can ask themselves is, “how can I quantify how likely an event is?” In this case, teachers can introduce this classic activity, using a standard deck of cards. Using a deck of cards provides a concrete look at probability and chance in a hands-on math activity. A typical deck of cards has four suits of thirteen cards in each suit, twelve face cards, four aces, twenty-six red cards and twenty-six black cards. Considering this, different probability questions can be asked to practice using this concept.


screen-shot-2016-11-10-at-12-36-55-pm

After introducing probability to your students, you can incorporate this activity within your lesson. Based on what they know about a standard deck of cards, students can answer questions, for instance, if you select one card randomly, what is the probability it is a heart?

CCSS.MATH.CONTENT.HSS.MD.B.5

(+) Weigh the possible outcomes of a decision by assigning probabilities to payoff values and finding expected values.

CCSS.MATH.CONTENT.HSS.MD.B.7

(+) Analyze decisions and strategies using probability concepts (e.g., product testing, medical testing, pulling a hockey goalie at the end of a game).

Allowing students to use the deck of cards to answer probability questions will help them reinforce their understanding. They will analyze and find strategies to know the probability of the specific card. This activity allows students to interact with their peers and reinforce their mathematical thinking of finding the probability of a certain card.

Where do your movies plot? CCSS.Math.Content.6.SP.B.4.

Where do your movies plot?

Star_Wars

In the United States we are living a society that is strongly influenced by pop culture. Trends come and go but during that short period of time students inundate the hallways with those trends. For example, throughout the month of December of 2015 students were all wearing Star Wars attire. The reason behind it was Star Wars The Force Awakens. If pop culture is so influential, then why not integrate it into our teaching? The activity I have in mind incorporates movies and their box office earning to teach students the CCSS.Math.Content.6.SP.B.4. Display numerical data in plots on a number line, including dot plots, histograms, and box plots. In the activity the students will be given a list of the top 100 record breaking box office earning in America (with out their respected earnings). The link is given below. To make this activity more relevant for the students the will have to choose their top 10 movies from the given list. The students will then graph their data on a number line, including dot plots, histograms, and box plots. The students will have many opportunities to use technology. The teacher can allow students time to research their top ten movie’s earnings and then graph their data using other tech resources such as Excel. At the end students can present and discuss their graphic representations of their data.

the-numbers.com/movie/records/All-Time-Worldwide-Box-Office

Show Me The Money!!

pro-sports-logos           sports-money

If you could choose professional a professional sport to play, which sport would you choose?  This activity is designed to show students how much the average annual salary is for 4 professional organizations over the past 25 years.  Students will look at the average salaries and make their arguments for the “most lucrative” sport.  Students will look for trends and try to predict what they think salaries might look like in 10 years.  This lesson will cover CCSS 6.SP.B.5. because students will use the statistics to make decisions about which sport they choose.  Students will be able to use these statistics to demonstrate central measures of tendency( Mean, Median, Mode) and use the statistics to support what sport they choose.  There will be a discussion about the length of each season and how many contests are in a season and determine how much each athletes make per contest and how that may change their decision.  As an additional extension, we will include women professional athlete salaries and compare and contrast those salaries with men.

The Odds of a Tasty Lunch: CCSS.Math.Content.7.SP.C.8.b

sandwich

Many students know how a good lunch can help to turn a bad day around, or make a good day even better. Perhaps the most common part of any lunch is the sandwich, and there are so many different sandwiches you can make. You can put it on a bagel or a baguette, with roast beef or ham, Swiss or cheddar cheese, tomatoes or lettuce, peanut butter or mayo, or whatever combination you might like. Fortunately, there is an easy way to explore your options: MATH. You might be thinking, “Why would I use math to make a sandwich?” If you use a probability tree, you can sketch out the different sandwiches you can make with particular breads, meats, and vegetables. If you can use math to help you make a decision like that, maybe you should be asking, “Why NOT?”

CCSS.Math.Content.7.SP.C.8.b
Represent sample spaces for compound events using methods such as organized lists, tables and tree diagrams. For an event described in everyday language (e.g., “rolling double sixes”), identify the outcomes in the sample space which compose the event.

MTV Math

MTV MATH

mtv

All middle school students enjoy listening to music in some way or another, if teachers can connect student interests into their lessons, such as music, the students are more likely to be engaged and excited to learn math. One example of this is by incorporating the Top 40 hit music into a 6th grade statistic lesson.

Students would be given a table with the top fifteen Top 40 music hits including the song title, the artists, and the length of the song. Students will need to organize the data and then use the data to find the mean, median, and mode of the data set. If desired teachers can also use this data to find five number summaries as well as the interquartile range and possible outliers. This falls under the 6th grade Common Core State Standard of CCSS.Math.Content.6.SP.B.5.c. This activity is engaging for 6th grade students because it pertains to their interests and teaches math in an exciting way while connecting to teen culture.

If wanted, this activity can be connected to other subject areas such as any music classes. Connections can be made between music history as well as music and today’s media. Students in music class can also study different musical genres and learn about radio editing.