 Learning Target – I will be able to use a motion detector to match and then create a time-distance graph. Represent two numerical variables on a scatter plot and describe any correlation and/or relationship between the two variables.
Common Core Standards: CCSS.Math.Content.HSF.IF.B.4, CCSS.Math.Content.HSF.IF.C.7.
Idea of the Lesson:
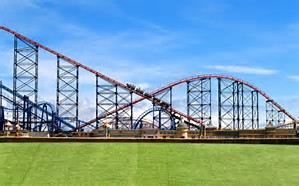
When students are introduced to the idea of slopes and rates, it is important to emphasize the application of slops and rates to the real world and the technology we can use to model this. The activity will help students connect the idea between slopes and roller-coasters. Then students will use a CBR, link cable, and graphing calculator with Easy data app downloaded to create a virtual roller-coaster. The benefit of this activity is that this is a real-world example of a job you can get with a math degree. The worksheet will be presented as a mathematician’s design of a roller-coaster. The students will also have to write up a conclusive “business proposal”.
Procedures:
- Teacher will remind students of a time distance graph.
- Create groups of 2 students each.
- Students will draw their ideal roller-coaster with no flips (each student draws their own, does not need to match their partner).
- Students will use CBR with calculator to create a simulation of their roller-coaster to match the slope while their partner runs the start/stop button.
- Write up their business proposal using proper vocabulary