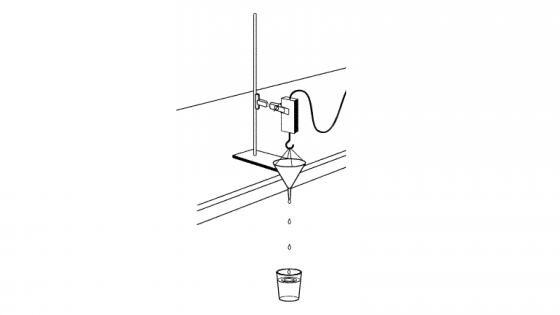
The idea of the lesson is for the students to be able to understand rate of change and how it can be represented. Students will be able investigate using the proper equipment to answer questions such as at what rate is the water level decreasing? How long will it take for the funnel to drain completely?
Overall, students will be able to meet the objectives of recording the weight versus time data for a draining funnel and describe the recorded data using mathematical understanding of slope of a linear function.
Common Core State Standard:
HSA-REI.B.3. Solve linear equations and inequalities in one variable, including equations with coefficients represented by letters.
HSS-ID.C.7 Interpret the slope (rate of change) and the intercept in the context of the data.
HSS-ID.C.8 Compute (using technology) and interpret the correlation coefficient of a liner fit.