System of inequalities (CCSS.Math.Content.HSA.REI.D.12)
Alignment to Content Standards
Alignment: CCSS.Math.Content.HSA.REI.D.12
Alignment: CCSS.Math.Content.HSA.REI.D.10
Tasks
Find the system of inequalities for the graph below. Write the inequalities in slope-intercept form.
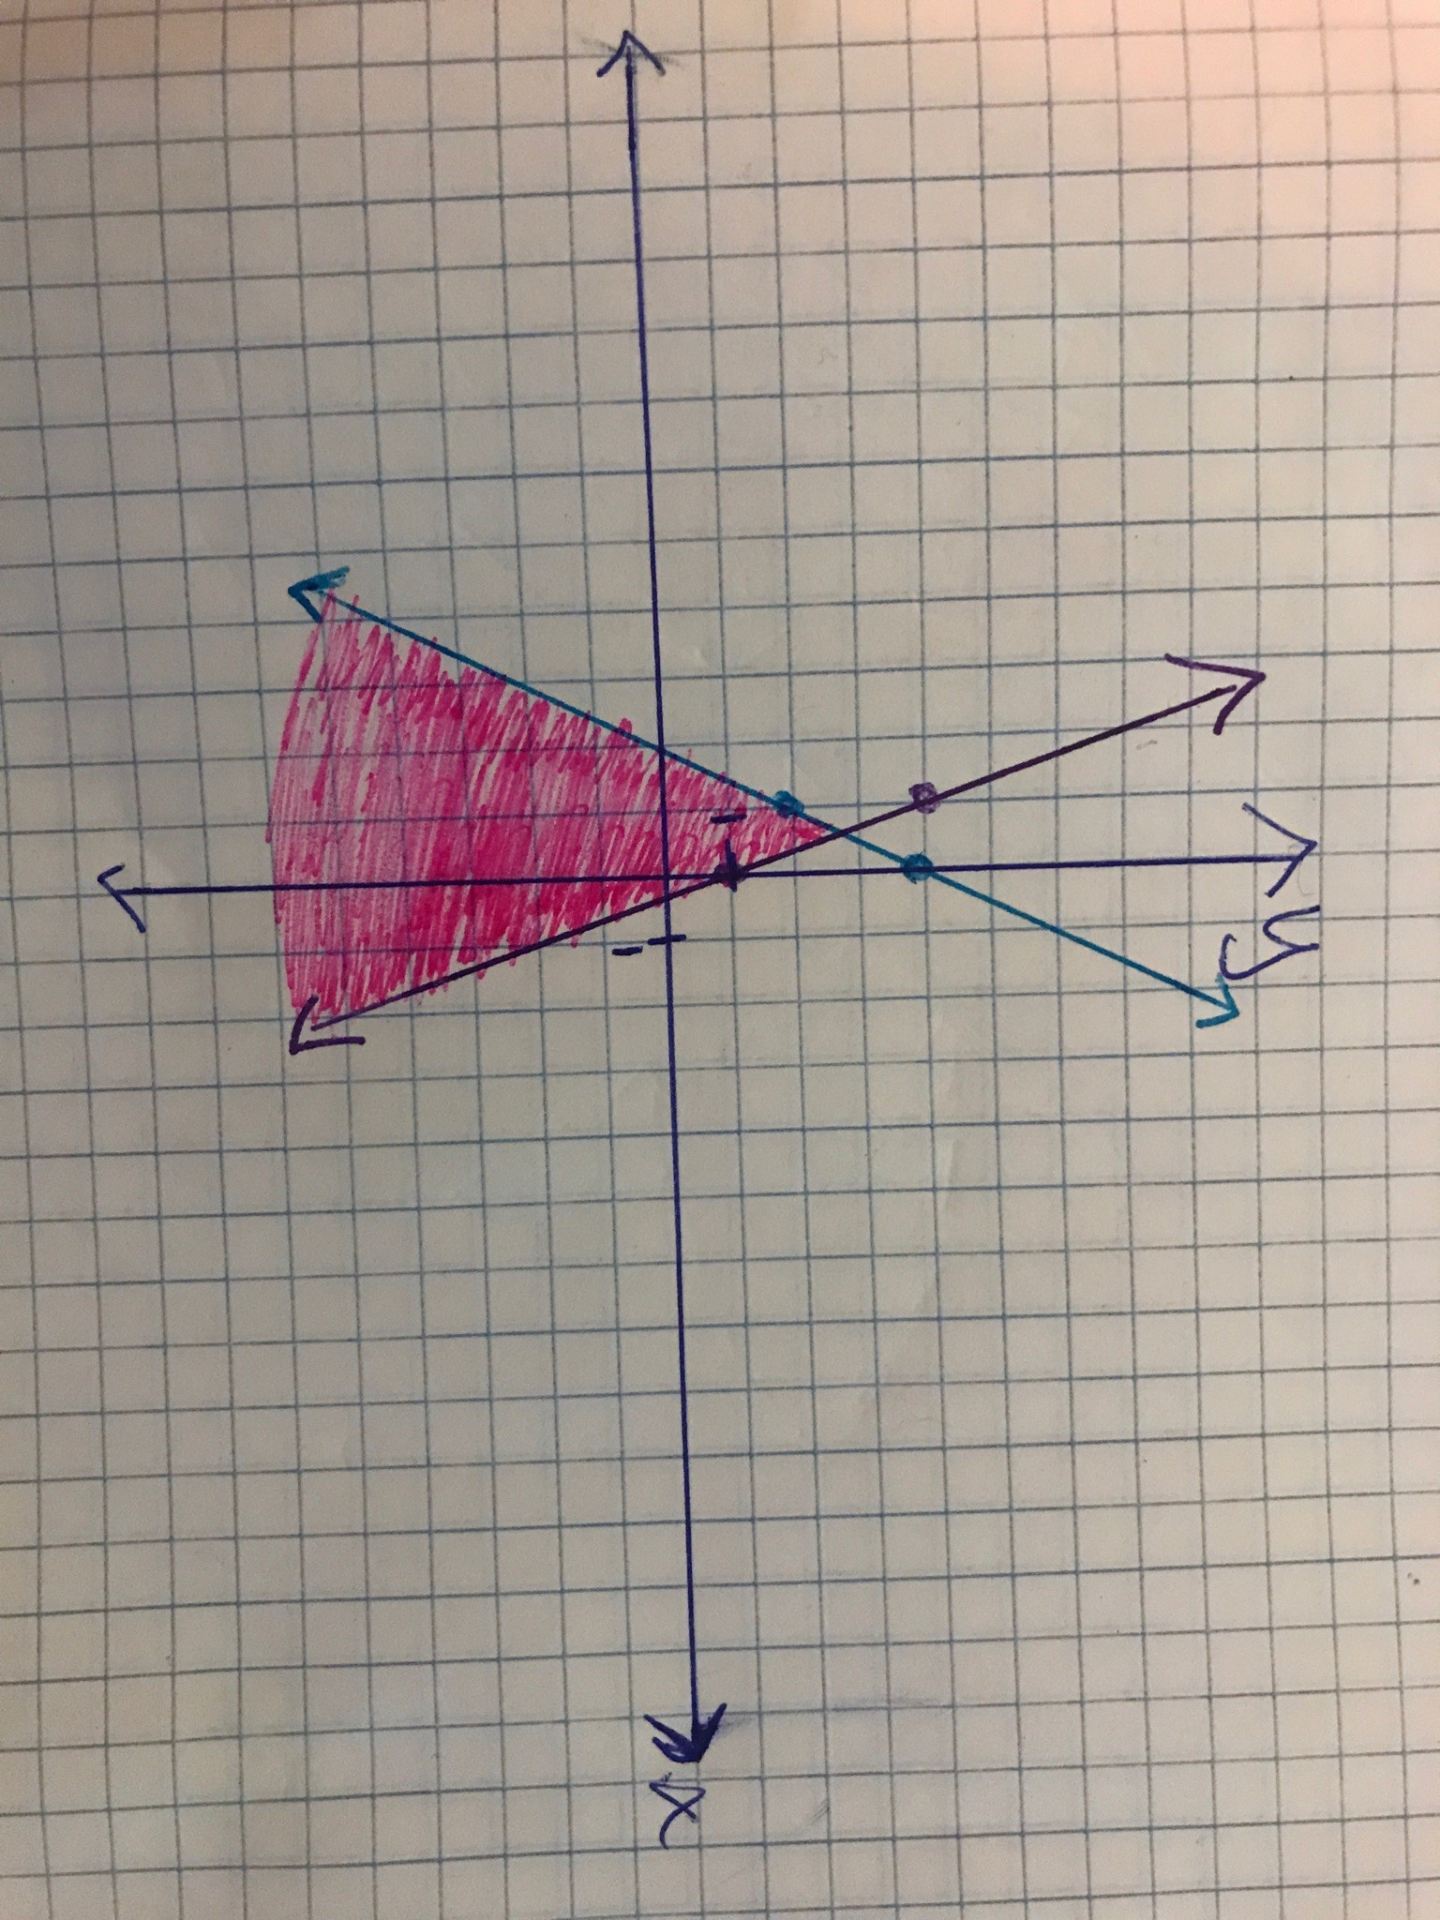
Then, determine if the following points are in the solution set of the system of inequalities:
(0,0), (1,1), (-1,1).
Commentary
The purpose of this assignment is to assess whether the students understand systems of linear inequalities and the solution set. In this task, the students will be working with two major skills. They will be creating equations for two inequalities in two variables for a system of equations from a graph. The students will also be determining if a point satisfies the solution set from the system of inequalities. The students will have to have a full understanding of the concept to be able to complete this assessment since the students are given the solution and must work backward to find the system that satisfies the solution.
Solution
The first step to completing this assignment, the students must first create inequality equations for each line. Since the assignment says the equations must be in slope-intercept form, the student can use the plotted points to calculate the slope and find the y-intercept for each then create the formula for the equation. They must then choose a point in the solution set, that is the shaded region, and plug that into their equations and choose the correct inequality symbol to create a true statement.
For the purple line, the slope is -3 and the y-intercept is 1; therefore, the equation for the line is y=-3x+1. Then by putting a point into the equation that is in the solution region and simplifying, we can find the correct inequality symbol. For this one I put in the origin point, (0,0) and simplified.
0 ? -3*0 + 1
0 ? 1, 0 ≤ 1
Therefore, the inequality should read y ≤ -3x + 1. The inequality has the equal to part since the line is a solid line and not a dashed line. If it was dashed then the symbol would only be less then, <.
For the blue line, the slope is 2 and the y-intercept is 4; hence, the equation for the line is y=2x+4. Similarly to the purple line, by putting in the origin, (0,0), which is a point in the solution shaded region, we can find which inequality symbol to use.
0 ? 2*0 + 4
0 ? 4, 0 ≤ 4
Thus, inequality is y ≤ 2x + 4. Again, since this line is solid the symbol contains the equal to part as well as the less then, <.
Finally, the student need to determine if the three points are in the systems solution set or not. The students can do this in two different ways. They can either look on the graph and see if the point is in the shaded region then it is in the solution set. Or the students can put the point into both equations and see if the statement is true for both inequalities. If the point creates a true statement for both, then the point is in the systems solution set. Therefore, (0,0) and (-1,1) are in the systems solution set and (1,1) is not.