School Presidential Elections
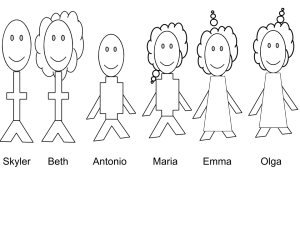
The students are learning about probabilities in math so they will apply these concepts to a real life event that happens every year in schools across our nation.This sample picture has so much meaning to all the students in the entire 7th grade class as it is about school culture. There is a number of probability activities this simple picture can expand to using mathematical practices as to who will win the election. Activities like: Will it be a girl or boy? Will it be the popular student or the student that delivers the best speech? Based on a mini session of class voting, will it be an accurate representation of the actual event? For this particular activity there is a total of 6 students in the running for class president, 2 boys and 4 girls. The students will use red poker chips for the girls and blue poker chips for the boys as well as a randomization holder (paper bag). This process will help determine whether a girl or boy will be president based on some fun probability activities (SEE HANDOUT ATTACHMENT). The students will also explain as to what parts of the activity are empirical or theoretical and why as well as learn the Law of Large Numbers. This activity aligns with CCSS.MATH.CONTENT.7.SP.A.1 & 2

