HSS.ID.A.1,2, and3! Box-and-Whiskers Plot

As many others, when I first heard of Box-and-whiskers plot, the first thing that came to mind was…

box


pluswhiskersequal

boxplotcat

question mark


But what does this have to do with math?! Through this learning progression we will be addressing this misconception and teaching students what a box-and-whisker plot really is and how it can be used to describe data. Students will begin by working with the measures of central tendencies to describe the center of a set of data. As students begin to form an understanding of these measures of central tendencies and how they allow you to interpret data students will be introduced to Tukey’s Five Number Summary and the box-and-whisker plot. Students will then learn how to use the box plot to interpret data, compare different data sets (shape, center, spread), and determine if there are any outliers within data sets

The Common Core Standards that are aligned to this progression are HSS.ID.A.1, HSS.ID.A.2, and HSS.ID.A.3. The following standards for mathematical practice are also aligned to this learning progression: MP3: Construct viable arguments and critique the reasoning of others, MP6: Attend to precision, and MP7: Look for and make use of structure.

Learning progression Bettermath

Statistics Lesson Plan PDF

G-MG.1: Feeding Minds

The 3-Act Math Task, Meatballs by Dan Meyer, can be found at http://www.101qs.com/2352-meatballs.  This activity is ideal for those spaghetti lovers in your classroom. It involves learning how to calculate how many meatballs can be placed in a pot of spaghetti sauce with out causing the sauce to overflow. This can easily relate to the majority of your students, whether they cook the spaghetti and meatballs themselves or they just eat it. This activity allows students to be constantly engaged through a subject of interest, various discussion starter questions, and mini videos.

Act 1 of this task begins with a video of boiling spaghetti sauce that ends with a bowl of meatballs about to be entered into the sauce pot. This is followed with the following discussion starter questions:

1. How many meatballs will it take to overflow?

2. What is a number of meatballs you know is too high?

3. What is a number of meatballs you know is too low?

This allows students to be fully aware of their central focus for the day and begin to brainstorm of the answer possibilities.

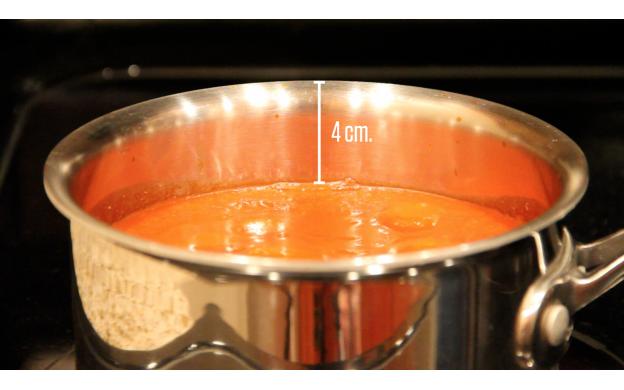
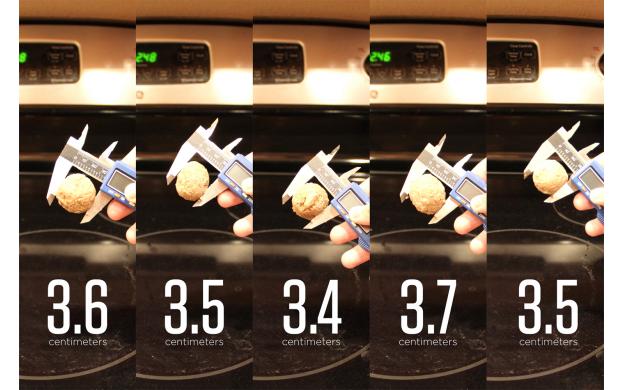
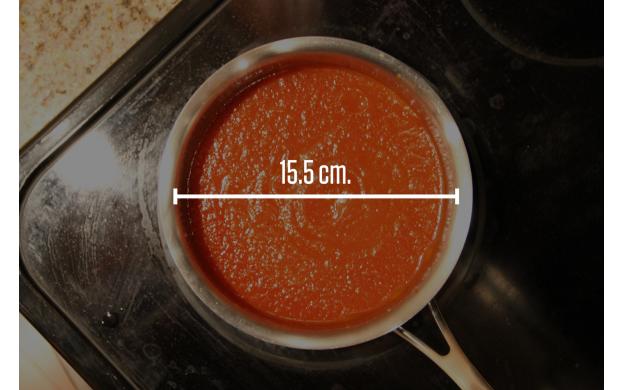
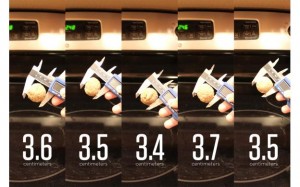
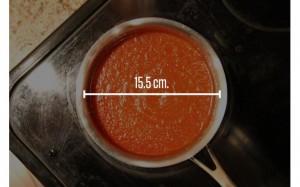
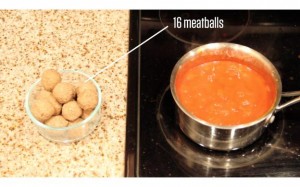
In act two students are asked what information would be useful to know here? As students begin to answer this question, the teacher will show the students images of the things that would be useful to know to answer the leading question (How many meatballs will it take to overflow?). The images consist of the height remaining in the pot, the diameter of some sample meatballs, the diameter of the pot, and the number of meatballs. During this act the teacher will also either teach or review volume formulas of cylinders and spheres so that they can proceed to the next act. Through this act students begin to think of ways in which they can approach this problem and what information is needed to begin to solve for the solution.

_1303_emptyheight_1304_meatballdiameter_1305_t_1306_t


During act three students will use the information collected during act two to calculate the space left in the pot and the volume of the meatballs and predict a number of meatballs that will fill the remaining space or cause the pot to overflow. Once students have made their calculations/predictions, the teacher will show a video of meatballs being placed in the pot one by one until the pot slightly over flows, providing students with the answer to check how close their predictions were.

This task is aligned to CCSS.Math.Content.HSG-MG.A.1: Use geometric shapes, their measures, and their properties to describe objects.  This task allows students to compare one shape (cylinder/room remaining in pot) to another (sphere/meatballs), as they are trying to determine how many meatballs fit in the remaining room in the pot. In order to do so students must be taught the volume formulas of these geometric shapes and be able to determine how one shape would fit into the other.

Meatballs is also aligned to CCSS.MATH.PRACTICE.MP4: Model with mathematics. Mathematically proficient students can apply the mathematics they know to solve problems arising in everyday life, society, and the workplace. For this task students used their knowledge of cylinders and spheres to determine how many meatballs they can put in their spaghetti sauce before it overflows. This can be applied by all students in their every day lives and shows students how math is a part of our daily lives and doesn’t only arise in school settings.

F.IF – Walking the Distance

Who doesn’t love technology? We know are students do, we can’t keep them off their phones! So, why not use this to our advantage? Integrating technology into our classrooms will spark our students’ interest and help them reach their full potential. As teachers, we need to prepare our students not only for their upcoming exams, but for the future. Using technology in a classroom will allow students to grow and learn to problem solve using available resources, as it is very likely that their future careers will involve some sort of technology. Vernier probes and software can be a great start to incorporating technology into our classrooms.

motion detectorOne example of Vernier equipment is the Vernier motion detector. This motion detector is available for $79 at www.vernier.com, measures objects as close as 15 cm and as far away as 6m, and is easily attached to a graphing calculator to graph your motions (distance over time).

This is a great tool to help students better understand linear equations in an interactive and fun matter. One application for this motion detector is to have students create their own linear equation by walking at a constant rate and having the motion detector record the data, then the calculator connected to the motion detector will graph their movement and let the students know if they succeeded in keeping their pace constant.​ The student will stand about a meter away from the motion detector and attempt to walk at a constant rate. The motion detector will collect data for 5 seconds. Once the data has been collected the students will choose show graph and observe the linear graph created. If their are any spikes or flat regions students will need to repeat the experiment. They will be given a worksheet to fill out and guide the experiment. As part of the worksheet students will need to pick two points from the graph and use them to find the slope, write down the slope, the y-intercept, and the linear equation of the line created.

lab.RWV-01-DQ-walk_the_line.560.315Students will learn to analyze the data in order to determine the slope and y-intercept of the linear equation as well as interpret the information attained. This activity is aligned with CCSS.Math.Content.HSF-IF.B.6.

Worksheet aligned with this activity:  http://www.vernier.com/files/sample_labs/RWV-01-DQ-walk_the_line.pdf

Images found at www.vernier.com

A.CED – Rearranging Equations to Solve for Desired Variables

A-CED Rearranging equations to solve for desired variables

Alignment: HSA-CED.A.4

HSA: Algebra

Domain: HSA-CED: Creating Equations

Cluster: Create equations that describe numbers or relationships

Standard: Rearrange formulas to highlight a quantity of interest, using the same reasoning as in solving equations. For example, rearrange Ohm’s law V=IR to highlight resistance R.


Solving For Variables

Recognize these equations? You will be rewriting the following given equations to solve for each variable.

1. Given that A= L x W (L times W)

i. Solve for L

ii. Solve for W

2. Given that P=2L + 2W

i. Solve for L

ii. Solve for W

3. Given that V= L x W x H

i. Solve for L

ii. Solve for

iii. Solve for H

3. Given that C =πr

i. Solve for r

4. Given that A = πr2

i. Solve for r

The following is the worksheet aligned with this task and includes the solutions.

Solving for Variables

Commentary

The purpose of this task is to provide an opportunity for students to understand that formulas and equations can be manipulated to solve for a desired variable. For example if students are asked to find the height of a rectangular prism given the length, width, and volume measurements, students should be able to use their problem solving skills to rearrange the familiar formula of V=L x W x H to = H in order to find the height of the rectangular prism.

Using formulas that are familiar to the students will allow student to gain a better understanding of how rearranging a formula is useful when having to solve for variables and can later apply this concept to more difficult equations and formulas in the future. It is also important for students to have prior knowledge of inverse operations and order of operation to successfully complete these problems.


G.SRT-Using The Leaning Tower of Pisa To Teach Trigonometry

leaning tower of pisa


This picture was found at http://en.wikipedia.org/wiki/Leaning_Tower_of_Pisa

Possible math problem: The Leaning Tower of Pisa leans at a 5.5 degree angle and has a height of 185.93 feet on its high side (left). Use what you know of the sum of interior angles of a triangle and the Law of Sines to determine the length of the horizontal displacement of the top of the tower.

This problem aligns with the following Common Core Standard:

CCSS.Math.Content.HSG.SRT.D.11

Understand and apply the Law of Sines and the Law of Cosines to find unknown measurements in right and non-right triangles (e.g., surveying problems, resultant forces).

All students will be given a copy of this picture and allowed to write on it. With the given information students should be able to use their prior knowledge to realize that creating a right triangle will aid the completion of this problem. Students should start by finding the missing angle by subtracting the angles 5.5 and 90 from 180. From their they will use the Law of Sines to find the missing lengths including the length of the displacement, the question is asking for.

This task will allow students to see how they can use their math skills outside of the classroom. Students will find finding the displacement of the Leaning Tower of Pisa interesting as it is interesting enough that a tower has tilted and is still standing and because it’s not the typical boring worksheet that students dread.

A.SSE-Tricking Our Students Into Practicing Their Math Skills

Students hate doing activities where worksheets are involved, but if it involves using a computer, somehow that eases their pain. Through Wolfram Demonstrations Project students will get a chance to visualize the changes different slopes and y-intercepts make to a linear equation as well as finding a point when given the y-intercept and slope of a linear equation. All this will be done without the hassle of having to draw multiple graphs by hand. This activity will be guided by a given worksheet that they are to complete in pairs.

Line GemOnce they have completed the worksheet students will be tricked into doing some more math. What better way to trick a student into practicing their math skills than a game? Line Gem 1 is an online Algebra game that requires students to find the linear equation that will cross the most gems in order to get the maximum points. Students will need to use their knowledge of slopes and y-intercepts to find the proper linear equations.

Being able to visualize a concept assists visual learners and their conceptual understanding. Through out this activity Wolfram Demonstrations Project will allow students to get a better understanding of linear equations, slopes, and y-intercepts, while Line Gem 1 will give students the practice they need to process the new concepts they learned, in a fun matter.

Lesson PlanLinear Function lesson plan
Lesson Activity LinearFunctionworksheet