Functions are the basis of algebra and future mathematics. This learning progression covers functions, linear equations, graphing, and generalizing all of it. The assessments will challenge students and ensure that the teacher knows their students have met the standard. The problems used are fun and engaging about real life situations where these concepts can be used. Also attached is a lesson plan about modeling how slopes change as lines change. This lesson uses a program called Geogebra to model the changing slopes for students. This lesson is great for a struggling Algebra class because students are able visually see how the slope changes from positive to zero and to negative. by using this program you are integrating technology into your classroom and grabbing your students attention. This learning progression address the common core standards CCSS.MATH CONTENT.8.F.A.1-A.3 and CCSS.MATH CONTENT.8.F.B.4-B.5. By using this leaning progression you students will learn about functions and have a good time while doing it.
Author: ramppk
3-Acts Math Task: Shower v. Bath
The Shower v Bath activity from Dan Myers’s Three-Acts Math tasks is about which one is cheaper, a shower or a bath. The first video shows a person taking a shower and a person taking a bath in order to set up the scenario. Then in part two it shows two videos, one showing the duration of the bath and shower, and one showing the time it takes to fill up to a gallon of water for both. Also in act two It tells you the cost of water in Mountain View, CA. In the last act the students answer questions based on the information they are provided. They have to figure out which one is cheaper, how long of a shower would they have to take to equal the same amount of water as a bath, and they will have to compare with their classmates.
http://mrmeyer.com/threeacts/showervbath/
The common core state standard for this activity is:
CCSS.MATH.CONTENT.6.RP.A.3
Use ratio and rate reasoning to solve real-world and mathematical problems, e.g., by reasoning about tables of equivalent ratios, tape diagrams, double number line diagrams, or equations.
To achieve the common core standard I would fist show my students the fist video of the person showering and taking a bath. I would then ask my students to predict what they thought the cheaper option was and why. This will get my students thinking about the problem of which option uses more water and which option is more expensive. Next I would ask my students what information they needed to solve the problem. After discussing this and coming to an answer I will then show my students the other two videos about the duration of the shower/bath and the water rate in minutes per gallon. This will help students reason and problem solve about a real world situation using mathematics.
Question 3-6 will be a good formative assessment to see if my students have achieved the learning target. These questions will get my students thinking and using their mathematical reasoning about this real world situation. The last question asks students to compare their data with their classmates. This will get my students creating charts, diagrams, averages, and generalizing the whole real world situation. This question will help show me that my students have met the learning target.
F.IF – Walking Velocity
Technology is a great way to engage your students in math class. Using technology in the classroom will help the students stay engaged in their learning. But how do we integrate technology into the classroom? There are lots of ways to do this; one way is to use the products of Vernier. Vernier is a company that specializes in teaching math and science with technology http://www.vernier.com/. One of their products is a motion detector that connects to a graphing calculator. This product can be used in many ways but for this lesson it will be used for measuring velocity.

When you do anything with motion you are probably interested in the distance traveled, time it took and the speed or the velocity of your motion. In this lesson students will learn about the four quantities and even more. Speed and velocity are often interchanged but are not the same thing. Speed tells you how fast you are going while velocity is the rate of change of position. Position is the distance from the starting point or origin and the rate of change is how fast something is moving to or from the origin. In this lesson students will explore velocity using the Vernier motion detector.
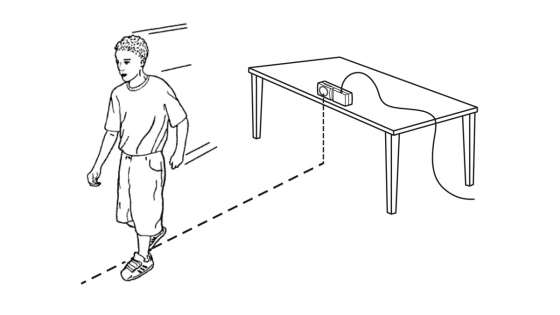
Students will set up the motion detector on a table with no objects in front of it. Students will stand one meter in front of the motion detector and walk slowly away for about two seconds at a uniform random rate. This will detect how fast you are moving and how far away you are form the motion detector. Then the student will walk toward the motion detector for the remaining of the time. All of this data will be collected by the motion detector for the students to analyze. The students will then answer analysis questions based on the data they collected. These questions are about velocity and how it changed as the students position and speed changed.
The common core state standard for this lesson is CCSS.MATH.CONTENT.HSF.IF.C.7Graph functions expressed symbolically and show key features of the graph, by hand in simple cases and using technology for more complicated cases. Students will graph and analyze their data found from the activity.
Worksheet for this activity: http://www.vernier.com/files/sample_labs/RWV-12-DQ-velocity_test.pdf
A.CED-The Rock Climber
CCSS.MATH.CONTENT.HSA.CED.A.1
Create equations and inequalities in one variable and use them to solve problems.Include equations arising from linear and quadratic functions, and simple rational and exponential functions.
Problem:
A mountain climber is scaling a 300-foot rock face at a constant rate. The climber starts at the bottom at 12:00 P.M. and by 12:30 P.M., the climber has moved 62 feet up the wall.
- Write an equation that gives the distance d (in feet) remaining in the climb in terms of t (in hours).
- At what time will the mountain climber reach the top of the rock face?
Commentary:
This problem deals with solving linear equations. The main thing is that the problem requires students to write their own equation. Students will have to interpret the word problem and write their own equation. This is good because it helps students better understand what they are solving for. This problem is an effective problem because it incorporates both writing the equation and then solving it at a certain value, in this case the top of the mountain. This problem allows students to identify the information given to make an equation and it requires them to use that equation to solve the problem.
Solution:
A) d= distance (feet)
t= time (hours)
The climber climbs 62 feet in half an hour (12:00 P.M. to 12:30 P.M.) Since t is in hours then you need to double both quantities.
62*2=124
So the climber climbs 124 feet per hour.
To put this in an equation you need the distance (d) to equal the constant rate per hour (124) times t.
d=124t
B) The rock climber will be at the top of the rock face when he is 300 feet high. So this means that d equals 300.
300=124t
Divide both sides by 124
So t equals 2.4 hours or 2 hours and 24 minutes
G.MG-Using A Picture To Model Surface Area and Volume
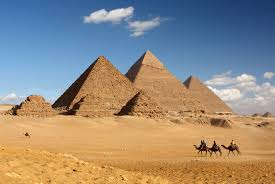
This is a picture of the pyramids in Egypt. Using this picture my students will be modeling the surface area of the pyramids and the volume as well. Students can predict the height of the pyramid by measuring the height and base of the pyramids with a ruler. They can then compare that height with the height of the people ridding camels to attain a more real life measurement. After finding the surface area and volume, I would have my students come up with the ratios between all of the different pyramids.
CCSS.MATH.CONTENT.HSG.MG.A.1
Use geometric shapes, their measures, and their properties to describe objects (e.g., modeling a tree trunk or a human torso as a cylinder).
CCSS.MATH.CONTENT.HSG.GMD.A.3
Use volume formulas for cylinders, pyramids, cones, and spheres to solve problems.
8.EE-Using Geogebra to Model Slope
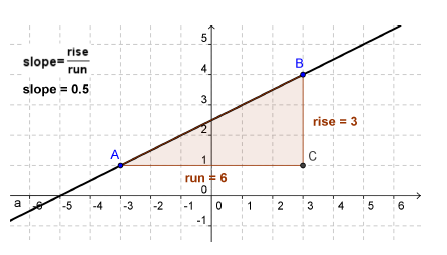
Geogebra is one of the best modeling programs a math teacher can use. When trying to figure out new ideas for the classroom it can be difficult. A good way for new ideas is to integrate technology in to your lessons. Geogebra is a great free program that can be utilized by any teacher. When used correctly Geogebra can greatly aid any lesson and help your students fully understand the material. For a quick tutorial you can watch this video. http://www.youtube.com/watch?v=q2_FwCx83Jc
In this technology lesson plan I am modeling the slope of linear lines using Geogebra. I used Geogebra to show the class how the graph changes as the slope of the line changes. In Geogebra you can use a movable line to demonstrate this change. After students will do a worksheet about the relationship between the look, the slope and y-intercept of the graph. This will help students understand linear equations and how they are graphed. This lesson plan is great for students struggling with the understanding of linear lines and the way they look.