Algebra 1: Exploring Linear Functions Understanding Slope and Intercepts

This learning Progression is based the Agile Mind Curriculum. During the introduction of functions students will plot the points from the table and determine how linear functions work and look like. By graphing and analyzing, students will begin to understand linear equations. Students will begin by understanding rate of change and slope whether the line is parallel and perpendicular. The equation slope will be learned and shown in different manners. Students will not be required to learn formulas, but build comprehensive understanding that help them understand and find key components of a linear equation/function.

The entry task for the beginning of the learning progression has students analyze the angles of perpendicular lines.

Opener

Students will be asked to use a protractor to measure the angle of the given lines. Students then will be able to determine that the angle is 90 degrees therefore emphasizing the concept of perpendicular lines (Fig. 1). They will understand that perpendicular lines make a right angle. Students will then be asked to describe the relationship between the given two lines using the following vocabulary: right angle, intersection, lines, and perpendicular.  

Assessment

This assessment requires students to dissect the given equation to determine the slope for a parallel and perpendicular line and then graph all the lines in the given problem.


Learning Progression: Linear Functions

Algebra 1: Exploring Linear Functions


This learning Progression is for an Algebra 1 Class  The curriculum used in this class is called Agile Mind which consists of a workbook, online animations, and formative & summative assessments. The name of this workbook is Intensified Algebra I: Student Activity Book, Volume I Representing mathematical relationships: the graders Linear Functions and their foundations, 2015-16 Edition. The math workbook has a guided lesson notes (fill in the blank) that follow the online animations that concur with the lesson, homework assignments, and a staying sharp section.

The book based on the agile mind curriculum.  This curriculum is built for students and for teachers who preferred formative assessments, job-embedded professional supports and real-time data & reports.  Curriculum was made for middle school students and high students. The Common Core State Standards cluster that this learning progression uses are as follows: Functions: 8th grade Define, evaluate, and compare functions:

  • CCSS.MATH.CONTENT.8.F.A.1
  • CCSS.MATH.CONTENT.8.F.A.2,
  • CCSS.MATH.CONTENT.8.F.B.4
  • CCSS.MATH.CONTENT.8.F.B.5.

These standards in Algebra address:

Unit 4: Linear Functions, Topic 10: Understanding slope and intercepts, will be the learning progression. This unit will reinforce the vocabulary, and analyze of linear functions using strategies and routines used in class. Topic 10 will connect the

ideas of rate of change with the slope of a line.  The use of different representations such as graphs, tables, function rules, and verbal expressions will be an essential part of 3 lesson learning progression.

The themes with in these three lessons (10.1-10.3) are as follows:

  • Practice of using graphs, tables, and function rules to analyze a linear function.
  • Discover the connection between rates of change versus slope and use it to analyze a linear function.
  • Use first differences to determine whether a function is linear or not.
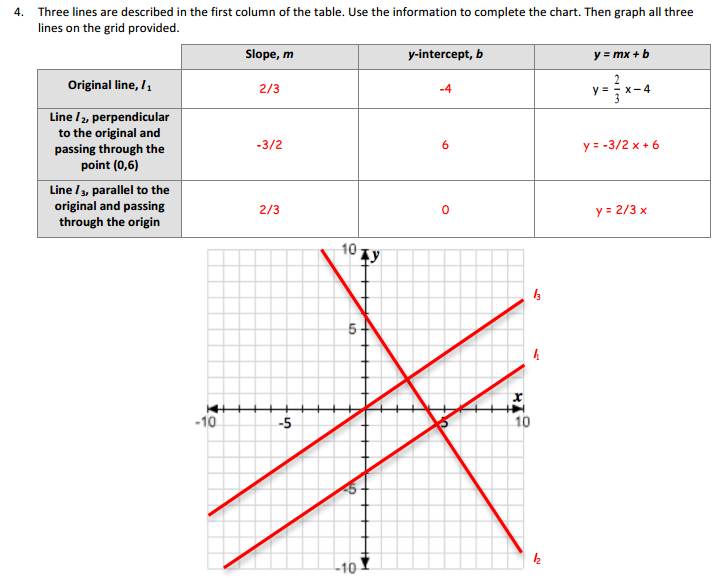
  • Explore the difference between an x-intercept and y-intercept and see how it is represented in a graph.
  • Learn how to determine whether a line is parallel

Linear Equations is one of the most essential lessons in the Algebra 1 curriculum. Emphasizing the retention of the concepts learned in this lesson is essential for the successful progressions for the rest of the mathematics sequence in high school. Formalizing a vocabulary and algebraic processes involving & analyzing attributes of linear functions will be the goal of this learning progression. In addition, Mathematical practices will be compacted in the following lessons. These are the mathematical practices being used in the previous learned strategies and routines that students will be developing will enhance the learning of the students.  The Mathematical Practices are as follows:

Link to Common Core Standards: http://www.corestandards.org/

Learning Progression Narrative (Autosaved)

Making HATS HSA.REI.B.4


Alignment to Content Standards

  • MATH.CONTENT.HSA.REI.B.4 Solve quadratic equations in one variable.
  • MATH.CONTENT. HSF-IF C.8  Interpreting Functions: Analyze functions using different representations.
  • MATH.CONTENT.8.F.B.5 Describe qualitatively the functional relationship between two quantities by analyzing a graph (e.g., where the function is increasing or decreasing, linear or nonlinear). Sketch a graph that exhibits the qualitative features of a function that has been described verbally.

Task

The cross section of a hat can be modeled by the following polynomial function:  

y=(1/27)(x-15)(x+15) where x and y are measured in cm. 

Given these facts, answer the following questions and be sure to show your work:

Note: sketch graph in your work.

  1. How wide is the hat (not including the bill)? Hint: we are looking for the diameter.
  2. Measurement of the Crown? Hint: Think of the lowest point in a parabola.


The IM Assessment, IM Assessment Commentary, and solution is attached:

IM Assessment (Commentary & Solutions included)

CO.B.8 We will find YOU

Throughout the years airplanes and air transportation have suffering from laser attacks. In this activity, students will solve a right triangle using trigonometry functions. Students will determine how far the laser point of origin is and the distance the authorities have to travel to catch the perpetrator. Watch the following CNN video before starting the assignment.

Video:

Click here for Picture Problem Worksheet:  Picture Problem

Common Core Standards:

CCSS.MATH.CONTENT.HSG.SRT.C.6
Understand that by similarity, side ratios in right triangles are properties of the angles in the triangle, leading to definitions of trigonometric ratios for acute angles.

CCSS.MATH.CONTENT.HSG.SRT.C.7
Explain and use the relationship between the sine and cosine of complementary angles.

Ice Hands: Modeling a human histogram and box & whisker plot

Standard: High School: Statistics & Probability » Interpreting Categorical & Quantitative Data »                          Summarize, represent, and interpret data on a single count or measurement variable»                          Represent data with plots on the real number line (dot plots, histograms, and box plots).

In this post, teachers will learn how to incorporate the Venier Easy Temp Sensor into a statistics lesson. The lesson will be about histograms and box & whisker plots. Data for the histograms will be provided by the temperature sensor which uses Easy data on a TI 84/83 graphing calculator. The data will be collected on the calculator. The data will be shown through a projector in class, so that students are able to copy the data on to their worksheets.

Teacher will set note cards across the room with different temperatures in the class. Students will form a line from coldest to warmest hand temperature. Students will then make a human histogram. Teacher and students will discuss how a histogram’s data can be manipulated. This will give students a chance to figure out how histograms and bar graphs can be distributed. This will potentially will reduce the questions that students make when making a histogram (distribution): “Can I go up by two’s? Three’s? Five’s…etc.”

Teacher will then introduce the idea of a box & whisker plot. Then students with the assistance of the teacher will make a human Box & Whisker Plot and symbolizing with a rope. The Rope will be segmented according to the minimum value, lower quartile, median, upper quartile and maximum value. Teacher and students will explore the characteristics of a box whisker plot and histograms to ensure understanding of the upcoming lessons.


Teacher Notes on Worksheet

Student Worksheet

Vernier Easy Temp Sensor

Temperature Facts

G.CO.D.13- Constructions Discovery Lesson Using the SMART Board to Reinforce Understanding

In this post, you will learn a lesson plan that uses the SMART Board Notebook program. The SMART Board, an electronic white board, comes with access to mathematical tools. The tools section has a button that allows you to make any geometric shape (circles, squares, etc…). The tools also include a compass, ruler, and straight edge that can be used to demonstrate constructions. This tool makes it easier for students to see where the needle of the compass goes and accurately shows how to properly use a protractor. The protractor and straight edge is transparent making easier for students to handle it. The compass is a manageable tool, where the pen can change colors to signify a specific construction.

In this lesson students will teach their peers how to construct a specific geometric figure. Students will do a presentation when they have mastered their mystery construction (square, equilateral triangle, octagon, and a regular hexagon). Students will have to master the constructions on paper before going up to present. Students will be able to self assess with in their group. The SMART Board will be use so students know how to manipulate the tools. Students will be presenting the mystery construction to their peers. The students will be presenting on the SMART Board because it is easier for students to see where to place the needle of the compass and how wide to open it. The constructions can also be done in different colors therefore emphasizing the number steps(scheme) is. Students will be motivated to participate in the lesson because they like using the SMART Board. This is a great way for teachers to integrate some technology in the classroom.

What am I constructing Worksheet

What am I Constructing Lesson plan & Success Criteria Rubric

Notebook Program (Students & Teachers)

Notebook Program Trial