Race Graph: 8.F.A.3, SSE.A.1.A, and SSE.B.3

This learning progression was designed primarily for a bilingual slower pace 9th -12th-grade Algebra 1 course. This class consists of twenty students of who ten do not speak any English and need assistance in Spanish. Throughout this unit, the lessons were provided in 50% Spanish and 50% English as well as all handouts having written directions in both languages. Aside from this class being slow paced because of the language barrier for some students there is also students who struggle in understanding. Overall, this course consists of about 50% not being able to graduate on time as the class is made up of eleven ninth-graders, four tenth-graders, three eleventh-graders and two twelfth-graders. About 50% of the students in this course are anticipated not to graduate on time as their lack of understanding affects more than this course.
The Common Core State Standards that will be satisfied are from three different domains. The first one comes from the cluster titles, “Define, evaluate, and compare functions” and is 8. S.A.3. The second one is SSE.A.1. A and comes from cluster “Interpret the structure of expressions.” The third standard is SSE.B.3 coming from cluster “Write expressions in equivalent forms to solve problems.” In this course, students focus on mastering 8th grade standards as they slowly incorporate high school content standards. Throughout this learning progression, students will focus on four mathematical practices which are MP1, MP4, MP5, and MP6.

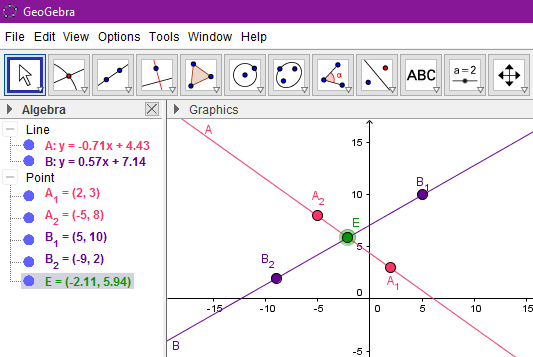
The central focus of this learning segment is for students to be able to analyze how the equation and the graph of a line are related. Students will represent a linear relationship as points on a coordinate plane and as an equation representing a line. Students will work towards this by learning how to solve a linear equation for y leading to them discovering slope-intercept form. In this form students, will identify the slope and y-intercept of a linear equation as well as on a graph. Once being able to identify the two pieces of information be able to quickly graph lines. As well as deepen their understanding of slope of a line by being able to explain how changes in the slope affect the steepness and direction of a line. The purpose of students being able to master these skills
is to deepen their understanding of graphing linear equations by providing a quicker method to graphing. Students will understand that making a T-chart or finding x and y-intercept can be time-consuming while using the slope-intercept form is more efficient. All this building their mathematical reasoning for the second unit which is the second half of the chapter which will focus on students exploring data to determine whether a linear relationship exists. They will be able to determine functions and work with modeling direct variation and find the slope and rate of change.

Full learning progression: edtpa Learning Progression

Lesson Plan: Algebra 1 EDTPA lesson plan

Right Triangles and Trigonometry: 8.G.B.6, 8.G.B.7, SRT.C.6, and SRT.D.8

This learning progression was designed primarily for a slower pace 9th-grade geometry course. The Common Core State Standards that will be satisfied are from two different domains. The first two standards come from the cluster titled, “Understand and apply the Pythagorean Theorem,” these are 8.G.B.6 and 8. G.B.7. The second two content standards come from the cluster titled, “Define Trigonometric ratios and solve problems involving right triangles,” which are HSG.SRT. C.6 and HSG.SRT. C.8. In this course, students focus on mastering 8th grade standards as they slowly incorporate high school content standards. Throughout this learning progression, students will focus on four mathematical practices which are MP1, MP3, MP4, and MP6.

The curriculum these students are going through comes from the 2011 Holt McDougal Larson Geometry textbook. For this learning progression, students are beginning a brand-new unit on right triangles and trigonometry. Specifically, applying the Pythagorean Theorem and its converse to classify types of triangles along with students being able to identify similar triangles and write ratios.

The central focus of this learning segment is an investigation of side lengths and angles in triangles to be able to find missing side lengths and being able to classify different types of triangles. The purpose of this content is to give students the mathematical tools to use to work with all types of triangles, especial right triangles. The underlying concepts are right triangles, Pythagorean theorem and its converse, and similarity of triangles. The simple knowledge in this learning segment includes the vocabulary relating to triangles, such as right triangles, and the definitions of all components to the Pythagorean Theorem and its converse. The procedure of this learning segment is for students to learn how to apply the Pythagorean Theorem to find the length of the third side in a right triangle, and then being able to use the Converse of the Pythagorean Theorem to decide if the three given side lengths form an acute, right, or obtuse triangle. After being able to find missing side lengths and being able to classify triangles students will be able to explore ratios of side lengths of similar triangles. All leading to students developing enough mathematical reasoning to apply their knowledge to real-world mathematics. Throughout each lesson, I will use the data on prior academic learning and disposition from my observations and the series of entry tasks students turned in to support my students’ learning. I sequenced my learning targets to start with familiar learning targets and branched to learning goals that depended on a mastery of the previous ones. Breaking down the learning objectives is beneficial to students with need of support or accommodations, since focusing students’ attainment of immediate goals, such as getting today’s problem correct increases student self-efficacy according to A. Wade Boykin and Pedro Noguera’s book titled “Creating the Opportunity to Learn.”

Complete Learning Progression: Geometry Formatted Learning Progression FINAL

GMD.B.4-Play Time with Play-Doh

play-doh

There is something very therapeutic about playing with play-dough. All children of all ages whether they admit it or not enjoy playing with play-dough and what better than to incorporate it into learning math. Using playdough in a subject that stresses many students can be very beneficial and making visualizing math concepts making the problems easier to approach.

For example, given the high school geometry standard:

CCSS.MATH.CONTENT.HSG.GMD.A.3
Use volume formulas for cylinders, pyramids, cones, and spheres to solve problems.*
We can work on solving problems like:                           play-dough-diagram
Given that the radius of a sphere of play-dough is 8 cm.
If the cylinder it needs to fit into is only 6 cm, what is the minimum height the cylinder must be in order to fit all the play-dough inside of it?


Allowing students first to try the problem hands on will work on engaging the students and with the visualization solving the problems will become less of a stressful situation. And from this, we can create other similar problems in which the shapes the problem works with changes. Such as what could change if we had a pyramid shape of play-dough that needed to fit into a cone shape container.

Slopes and Cents- HSS.1D.B5

What is the relationship between weight and quantity?

Taking into consideration that the slope of a line describes its steepness. We can also say that the slope can represent a number of other important mathematical concepts, such as the relationship between the weight of an object and its quantitypennies. This relationship can be modeled graphically by plotting the measure of the different amount of pennies versus its weight. In this activity, in small groups, we will use a Force Sensor to collect a linear set of data points. We will measure the weight of 8, 16, 24, and 32 pennies. Using this information, we will analyze the data and interpret the meaning of the slope as it relates to the independent and dependent variables. Using a model, we will be able to predict future measurements and interpret past results. tool

In the Slope and Cents activity, students will work in small groups to collect the data and collaborate to interpret the slope of the line they come up with using their data points. The objective of this activity is for students to collect weight versus number data for a collection of identical pennies. Model the weight versus data using linear equations. And lastly, interpret the slope and intercept values from the linear model.  experiment

Materials to complete this activity:

  • Dual-Range Force Sensor
  • Interface
  • LabQuest
  • Pennies or any coin you choose to work with.

This activity aligns with:

  • CCSS.MATH.CONTENT.HSS.ID.B.5
    Summarize categorical data for two categories in two-way frequency tables. Interpret relative frequencies in the context of the data (including joint, marginal, and conditional relative frequencies). Recognize possible associations and trends in the data.
  • CCSS.MATH.CONTENT.HSS.ID.B.6
    Represent data on two quantitative variables on a scatter plot, and describe how the variables are related.
  • CCSS.MATH.CONTENT.HSS.ID.B.6.A
    Fit a function to the data; use functions fitted to data to solve problems in the context of the data. Use given functions or choose a function suggested by the context. Emphasize linear, quadratic, and exponential models.
  • CCSS.MATH.PRACTICE.MP1: Making sense of problems and persevere in solving them.
A benefit of using technology when teaching this concept is that you make the concept hands on relatable by incorporating coins. Using an object that students are exposed to on a daily basis allows the students to bring the object from the real world into the classroom. And most importantly using activities like this allows students to move around and get involved rather than sit and read information out of a textbook. Students get to collect their own data rather than take a list provided for them. By doing this, you engage a wider range of your students.
Slopes and Cents activityslopes-and-cents
Link to website of equipment and activities: #standards

Modeling Systems of Equations fun with GeoGebra: HSA.CED.A.1

geogebra-demonstration

GeoGebra is dynamic mathematics software for schools that joins geometry, algebra, and calculus.  This software is a fantastic tool for students of all ages. For this lesson plan, I incorporated the topic of solving linear systems of equations using the benefits of having GeoGebra. I had students work through the process of graphing the systems of equations by hand but had them use the tool to check their work for them to have instant feedback. This allowed students to check their models and provided them with an instant model of what their systems should look when graphed. I also included a challenging problem where the students worked with a system that included a quadratic equation. This was something for the students to think about since we had only been working on linear equations. Using GeoGebra provided a great model representation of this particular system and allowed the students to see that a system could include more than linear equations. Throughout this activity I also had students work on creating their equations given points to work from to allow for deeper thinking.

modeling-activity-complete