Choose your own Adventure! Solving Systems of Linear Equations. A.REI.C

This learning progression is an approach to teaching how to solve systems of linear equations by graphing, combination, and substitution in a student-lead learning environment.

Standards: The Common Core State Standards that will be satisfied are from the High School Algebra: Reasoning with Equations and Inequalities cluster. We will cover CCSS.MATH.CONTENT.HSA.REI.C.6 solving systems of linear equations exactly and approximately. We will also prove that given a system of two equations in two variables, replacing one equation by the sum of that equation and a multiple of the other produces a system with the same solutions with standard CCSS.MATH.CONTENT.HSA.REI.C.5. In this course, students focus on mastering basic algebra knowledge that is required by the state, while integrating in common core standards and mathematical practices. In this learning progression the students will use four mathematical practices including: MP4, MP5, and MP7.


Algebra I learning progression-1egtu8b

Learning Progression Winter 2018-1ozkjgh

Fun in the sun with converting Percents, Decimals, and Fractions CCSS.MATH.CONTENT.4.NF.C.5

My learning progression is on converting percents, decimals, and fractions. It will lead to comparing ratios and using fractions and percents for ratio lengths. I will cover how to convert from percent to decimal to fraction and vise versa. I will start off with a hinge question then go in with my lesson. I plan to have the students in groups of four and they will be handed a worksheet of conversion.

learning progression percents edtpa-12sg8wn


Apartment Proportions 7.G.A.1

Apartment Proportions

Problem:

Congratulations! You just got your first apartment. It’s located right in the heart of downtown Ellensburg. You just realized you do not have anything to put in your new living room which is 14’ by 12.5’.

Sadly, the store you want to get your furniture from only has a few options but they come in multiple proportions. Make sure you have at least one item from each of the categories. If an item is too large or small, use ratios to change the proportions. You are only allowed to have ten of the following items in your living room!

Hint: Do some of the sizes seem odd? You should probably use ratios to change the size.

Show your work!

Below are the furniture you can select from with the measurements.

Seating                                                            Misc

Couch 8’x4’                                                    Lamp 4’x4’

Chair 2’x3’                                                     Fan 4’x2’

Bean bag square 3’x3’                                  Bookshelf 3’x2’


Table                                                              Entertainment

Coffee Table 16’x9’                                       TV with stand 12’x10

Side Table .5’x.5’                                           TV 10’x2’

                                                                           Gaming Consoles 4’x6’

Rug

Fuzzy Rug 15’x8’

Rug 14’x6’


This picture was found at Clipart-Library. This lesson will focus on the CCSS.Math.Content.7.G.A.1 which is solve problems involving scale drawings of geometric figures, including computing actual lengths and areas from a scale drawing and reproducing a scale drawing at a different scale.

I would teach this culturally by understanding that all students come from different cultures and different cultures have different housing expectations.

Other standard:

CCSS.ELA-Literacy.W.7.4
Produce clear and coherent writing in which the development, organization, and style are appropriate to task, purpose, and audience.

Inca Ancient Civilization Picture Problem 4.NBT.B.4

The image displayed above could be used in an integrated math classroom to help teach 4th grade math students about mathematical practices from ancient civilizations as well as record keeping techniques. Often times, we get caught up in the paper and pencil way of showing one’s work. By integrating a bit of Inca history in our math classroom we can elicit a different form of showing work and have some creative and artistic fun while we’re at it. A rich math task to help students model adding multi-digit whole numbers is to have students learn about Inca culture and create a quipu, which is a knot technique used to add multi-digit whole numbers.

Students would be able to read about Inca life and customs and then create a quipu using numbers of their choice. Once students are taught the fundamentals about what certain knots represent and how they are positioned, they can create their own quipu that displays an algebraic equation. An extension that can be used with this task is to have students trade quipu and determine what the equation represented is and check to make sure the answer represented is correct. Another extension would be to have students divide into stations and go around to each station and use a handout to write down the equations represented on various quipu and move about the room until they have been to each quipu station.

This task is a rich math activity because it can be done by all students of varied skill levels. Advanced students  can create more complex equations, while struggling students can create much simpler equations. This task also provides multiple pathways in the sense that students can creatively represent their equations on their quipu with a variety of colors and string lengths.

The multicultural aspect of this picture activity is that it not only integrates a different form of writing math equations, but it also introduces students to Inca culture and other social studies content. Writing and literature are another integration that can be used with lesson because students read informational text about people of the Inca culture and then get an opportunity to write about how the advancements of mathematics have evolved, Inca history itself, and how students created their own quipu.

Integrated Common Core State Standards and Mathematical Practices Addressed:

CCSS.Math.Content.4.NBT.B.4
Fluently add and subtract multi-digit whole numbers using the standard algorithm.

CCSS.ELA-Literacy.RI.4.7
Interpret information presented visually, orally, or quantitatively (e.g., in charts, graphs, diagrams, time lines, animations, or interactive elements on Web pages) and explain how the information contributes to an understanding of the text in which it appears.

CCSS.ELA-Literacy.W.4.2.d
Use precise language and domain-specific vocabulary to inform about or explain the topic.

CCSS.Math.Practice.MP4 Model with mathematics.

CCSS.Math.Practice.MP5 Use appropriate tools strategically

CCSS.Math.Practice.MP6 Attend to precision.


Playground Shapes 7.G.B.4, 7.G.B.6

Problem:

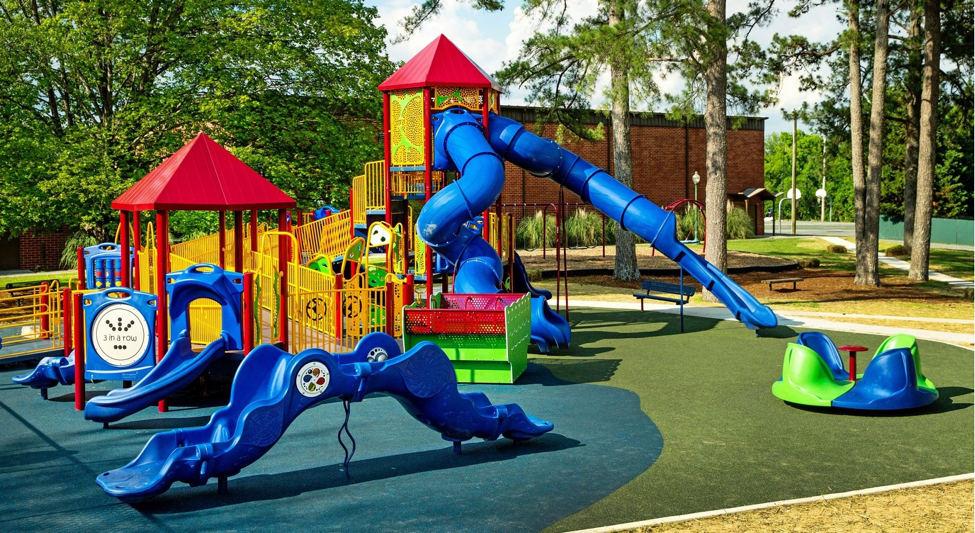
For this lesson, students will be using the image of the playground to identify different two- and three-dimensional shapes they can find, and then estimating possible measurements to use to find the area, volume, and surface area of the shapes identified.

The first part of the lesson will be each student generating a list of what two- and three-dimensional objects they see. After about 5 minutes, students will have a chance to discuss and compare in groups. Once the groups have shared their findings, the class will come together to share all of the shapes and objects that are in the picture. Estimations will be determined for measurements, so that there are concrete numbers for the students to use when calculating area, volume, and surface area.

Based on the standards associated with this lesson, the main focus will be on two dimensional circles, triangles, quadrilaterals, and three-dimensional cuboid objects.

Connected math standards:

7.G.B.4 – Know the formulas for the area and circumference of a circle and use them to solve problems; give an informal derivation of the relationship between the circumference and area of a circle.

7.G.B.6 – Solve real-world and mathematical problems involving area, volume and surface area of two- and three-dimensional objects composed of triangles, quadrilaterals, polygons, cubes, and right prisms.

Extension:

Students who quickly progress through the shapes and objects associated with these standards can be challenged with the triangular pyramids in the picture. Also, the standard 8.G.C.9 is about using the formulas for the volumes of cones, cylinders, and spheres and using them to solve real-world problems. This is a clear extension of this activity since there are cylinders in the image, and students can be challenged to use what they know to estimate the volume of the entire slide.

Cultural relevance:

This lesson is culturally relevant to students because playgrounds are usually a place of fun for younger students, so in this way students are finding the math associated with a place that hopefully inspires positive feelings for them.

Standard from another content area:

CCSS.ELA-LITERACY.SL.7.1 – Engage effectively in a range of collaborative discussions (one-on-one, in groups, and teacher-led) with diverse partners on grade 7 topics, texts, and issues, building on others’ ideas and expressing their own clearly.

World Population [Picture Problem] 8.F.B.5, L.8.3, and MP.1

By: Kimberly Younger

This image of the world, from World Mapper is skewed based off the current population in each country. Students will be assigned a country and will be asked to find out the population of the country in 1918 and the current population (2018) then they will compare the the change in population.

The lesson will focus on the standard CCSS.Math.Content.8.F.B.5 which is finding the functional relationship between two quantities, whether they are increasing or decreasing and for the this lesson they would be focusing on only linear functions. The lesson will be called Population Change Project, students will sketch the graph with the population data they collect and write a paragraph about the data the collect and interpret what it means. Including information about why they think the population increased or decreased.

This Lesson is culturally responsive because students will be learning about other countries and why the population may have increased or decreased over decade (1918 – 2018). Students could be supplied with websites which show the current population and the passed population or they can be given time to do the research on their own.

The students will use the mathematical practice of CCSS.Math.Practice.MP1 which focuses on students problem solve and preserve in solving math problems. CCSS.ELA-Literacy.L.8.3 is the use knowledge of language and its conventions when writing. The evidence of this standard would be found when students complete their write up about the change in population over the passed decade.

What Does the Motion of a Rolling Object Look Like? HSF.IF.B.4

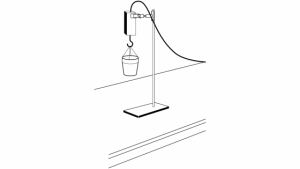
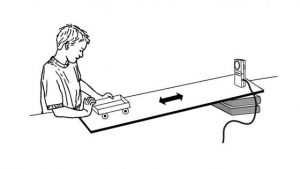
Students can get easily confused when it comes to understanding variables of a graph and visualizing what that information represents. This activity will allow students to see how the path of an object moving toward and away from a given point is modeled. With the use of their TI-84 Plus graphing calculators and the Vernier CBR-2, students in small groups will study the motion of a tennis ball and a toy car rolling up and then back down a ramp. This gives them an opportunity to practice interpreting  the motion of the objects through a hands on activity.

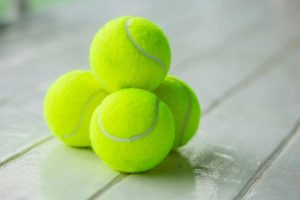
The graphs for the motion of either object should be similar in that they are parabolas, but students will be able to see what determines their properties. At first, they will be asked to visualize and sketch what they imagine the graphs would like. Then by using the technology explained, they can see how their original assumptions compare to the graphs obtained from the motion detector. This will encourage students to critically think about an object in motion and have a better understanding of how its distance from the starting point in relation to time is represented.

Activity Worksheet-Rolling Through Motion

Practice Standard:

CCSS.Math.Practice.MP5- Use appropriate tools strategically

This activity relates to the Common Core State Standard:

CCSS.Math.Content.HSF.IF.B.4
For a function that models a relationship between two quantities, interpret key features of graphs and tables in terms of the quantities, and sketch graphs showing key features given a verbal description of the relationship.

Weighing in on linear correlations A.REI.A

When students first learn about how to graph a linear function they are often confused about what the correlation is between the independent and dependent variables. To some students a linear function just seems like a magic trick about how to obtain an x-value when given a y-value. This activity will be able to solidify the concepts of a linear function because all of the pennies will have the same weight. If the students double the amount of pennies then the weight should also double. This can be easily done using the Dual-Range Force Sensor produced by Vernier Software & Programming. This device is compatible with computers, Chromebook, mobile devices, and several additional platforms.

In this activity, students will be working in groups of 3-4 and will be given a Dual-Range Force Sensor and 48 pennies per group. The students will start by using 8 pennies and measuring the weight, then 16 pennies, then 24 pennies, and so on until they weigh all 48 pennies while recording the weight for every 8 pennies. The students will then be plotting the values on the coordinate plane, and by using the slope formula to determine the weight of each penny, and find the function that represents their data. This will allow for students to understand the correlation of x and y-values in a linear function.

Common Core State Standards:

CCSS.Math.A-REI.10- Understand that the graph of an equation in two variables is the set of
all its solutions plotted in the coordinate plane, often forming a curve
(which could be a line).

CCSS.Math.N-Q.1- Use units as a way to understand problems and to guide the solution
of multi-step problems; choose and interpret units consistently in
formulas; choose and interpret the scale and the origin in graphs and
data displays.

Shape Sorter Activity CCSS.Math.Content.6.SP.B.5.b

By: Nick Spencer, Sam Marcoe, Grayson Windle, Elizabeth Englehart

With the Shape Sorter activity, which can be located at this website, we enable our students to work with several different concepts such as venn diagrams and geometric patterns.  The students work with a venn diagram in which they can set up two “rules” for each side of the diagram, and then are tasked with organizing the shapes accordingly to the rules.  If a shape meets both standards set by the rules, the student can place the shape in the center of the venn diagram, and if the shape doesn’t meet the criteria for either rule the student can leave it outside of the venn diagram.

In the figure above, my group of teacher candidates created our own venn diagram with these two rules:

  1. The figure has at least one line of symmetry (left side)
  2. The figure has rotational symmetry (right side)

In the beginning of this activity, we have several different shapes and begin organizing them in the matching part of the venn diagram based on their geometric characteristics.  The figures on the left side of the diagram have at least one line of symmetry while the figures on the right have rotational symmetry.  The figures in the center have both characteristics set by our rules, while the figures on the outside have neither lines of symmetry nor rotational symmetry.

This online educational activity allows the students to further develop conceptual understanding, and practice procedural fluency for geometric shapes and laws, as well as develop understanding for venn diagrams.  By allowing students to combine geometry with venn diagrams, students can open their perspective that venn diagrams can be utilized in various and unique situations.


HS Genetics Lesson using Hardy Weinberg Equation N.Q.A

This learning progression was used in a 10th grade biology classroom. The students are completing a unit on genetics are learning how to calculate allele frequencies in a population. This unit will focus on Common Core State Standards (CCSS) and Next Generation Science Standards (NGSS).

Standards:

CCSS.MATH.MP5: Model with mathematics

CCSS.MATH.CONTENT.HSN.Q.A.2: Define appropriate quantities for the purpose of descriptive modeling.

NGSS HS-LS3-3. Apply concepts of statistics and probability to explain the variation and distribution of expressed traits in a population.

The learning progression and activity is attached below:

edtpa learning progression

Genetics Lab pg 1