Where Will We Meet? REI.C.6

Solving Systems of Linear Equations

Standards for Mathematical Practice: Modeling with Mathematics

CCSS.MATH.CONTENT.HSA.REI.C.6
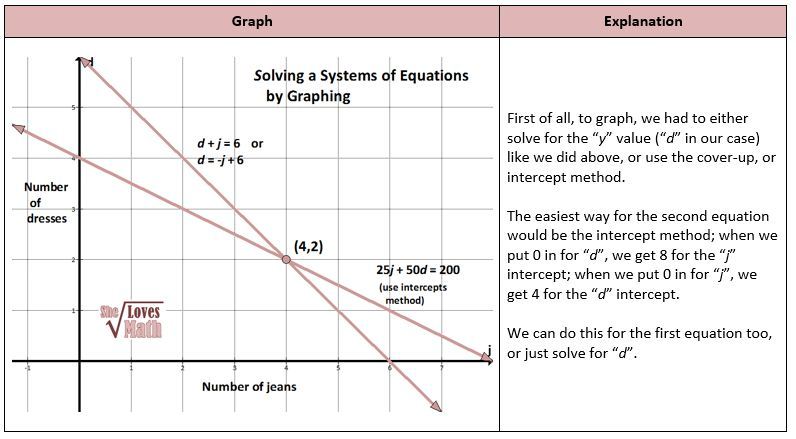
Solve systems of linear equations exactly and approximately (e.g., with graphs), focusing on pairs of linear equations in two variables.

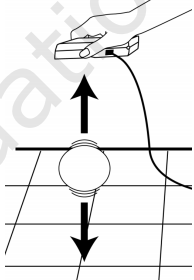
In life, many things take more than one equation to figure out and solve. Things are not exactly the same as the next, particularly when it comes to speed. This math activity allows the students to use Vernier’s CBR-2 and be kinesthetically involved as they learn about what they are doing. The point of this assignment is to use the motion detectors and have their graphing calculators graph the motion of two walkers simultaneously. This will be done in a few different ways so they can see how it is useful to know this math. They will do some where one person is walking and the other person is going faster in an attempt to see where they can “catch up” to the first person. They will also do some where they are going different ways and see where they cross paths depending on the different speeds of the people.

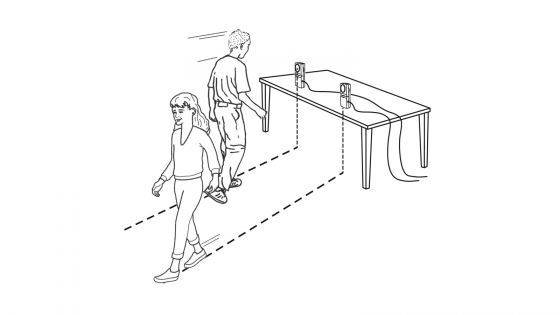
Using the CBR-2 motion detectors will be helpful in keeping the students engaged because it is excited and they have to figure out where they will be crossing. There will definitely be some questions where they have to try and meet certain information like the placement of meeting or have one person at a certain speed. This uses the math practice of modeling which is good because they can use their information from physically doing it and being able to graph the information, then pull the specific data from the graph. The CCSS.MATH.HSA.REI.C.6 relates to this because it is about solving systems of linear equations which there are doing by seeing when their graph of their walking speeds intersect.


HS Genetics Lesson using Hardy Weinberg Equation N.Q.A

This learning progression was used in a 10th grade biology classroom. The students are completing a unit on genetics are learning how to calculate allele frequencies in a population. This unit will focus on Common Core State Standards (CCSS) and Next Generation Science Standards (NGSS).

Standards:

CCSS.MATH.MP5: Model with mathematics

CCSS.MATH.CONTENT.HSN.Q.A.2: Define appropriate quantities for the purpose of descriptive modeling.

NGSS HS-LS3-3. Apply concepts of statistics and probability to explain the variation and distribution of expressed traits in a population.

The learning progression and activity is attached below:

edtpa learning progression

Genetics Lab pg 1

Graphing Linear Equations A.REI

This learning progression is for a high school algebra class. In this unit, students will learn important concepts about graphing linear equations. In the first lesson,  students will learn about the different properties of a graph. For the second lesson, it will be broken down to two days. Students will check whether the set of ordered pairs are  solutions to both the equation and the graph. The next day,  students will be introduced to writing the equation as a function form. For the third lesson, students will  learn how to find the x-intercept and y-intercept  both algebraically and graphically.

The following Common Core State Standards will be satisfied in this unit:

The following Mathematical Practice will be satisfied:

Learning Progression is attached:

learning progression for edtpa


A Beginning Look at Calculus IF.B4

This learning progression is for a high school calculus class. This is the first unit of Calculus, where students will be introduced to the two goals of calculus. The learning progression will start first by students developing concepts of slope and slope functions. Students will show how particular functions change by examining finite differences.

The learning progression aligns the following Common Core State Standards:

MATH.CONTENT.HSF.IF.A.1

Understand that a function from one set (called the domain) to another set (called the range) assigns to each element of the domain exactly one element of the range. If f is a function and x is an element of its domain, then f(x) denotes the output of f corresponding to the input x. The graph of f is the graph of the equation y = f(x).

MATH.CONTENT.HSF.IF.A.2

Use function notation, evaluate functions for inputs in their domains, and interpret statements that use function notation in terms of a context.

MATH.CONTENT.HSF.IF.B.4

For a function that models a relationship between two quantities, interpret key features of graphs and tables in terms of the quantities, and sketch graphs showing key features given a verbal description of the relationship. Key features include: intercepts; intervals where the function is increasing, decreasing, positive, or negative; relative maximums and minimums; symmetries; end behavior; and periodicity.


The learning progression aligns with the following Mathematical Practices:

CCSS.MATH.PRACTICE.MP1

Make sense of problems and persevere in solving them.

CCSS.MATH.PRACTICE.MP2

Reason abstractly and quantitatively.

CCSS.MATH.PRACTICE.MP8

Look for and express regularity in repeated reasoning.


The learning progression can viewed at the link below

calculus Continue reading

The Path To Simple Savings HSA.REI.D.11

Image result for dollar sign

Student engagement is key when creating lessons. This lesson revolves around modeling for savings, which is a great source of engagement for students. Using the lesson plan provided, students will create models, using a graphing calculator or desmos.com, based on simple interest savings scenarios. Students can then apply these concepts to everyday life.

Click to view this lesson plan: Interest Modeling

Graphing Quadratic Functions HSF-IF.C.7

qgraph

For this lesson, students will participate in a group activity using their graphing calculators. The students will be asked to turn standard form quadratic functions into vertex form. In addition, the students will find the graph and sketch it on the board. Then, they will label the graph with the vertex, x-intercepts, and y-intercepts.

math-lesson-plan-template2016

Just How Strong is Gravity? HSF.IF.C.8.B

Do you ever wonder just how strong gravity actually is? What is this invisible force that is holding all of us down? Does gravity affect all object equally? These questions and more can be answered with an engaging classroom activity.

For this lesson,  we will use a vernier motion detector to model the effect of gravity on various objects. Product image for Calculator-Based Ranger 2

The objects used will be dropped from a specific distance away from the probe and the data collected will be used to help estimate for the force of gravity. Students will be broken up into small groups of 3-5 students. Each group will be given three objects to model with: a book, a piece of paper, and a baseball. Groups will then drop their objects following the worksheet directions and find an estimate for gravity based on their findings.


Content standards included in the lesson:

  1. CCSS.MATH.CONTENT.HSF.IF.C.7 – Graph functions expressed symbolically and show key features of the graph, by hand in simple cases and using technology for more complicated cases.*
  2. CCSS.MATH.CONTENT.HSF.IF.C.7.A – Graph linear and quadratic functions and show intercepts, maxima, and minima.
  3. CCSS.MATH.CONTENT.HSA.CED.A.1 – Create equations and inequalities in one variable and use them to solve problems. Include equations arising from linear and quadratic functions, and simple rational and exponential functions.

Activity Adapted from Vernier’s Bounce Back: Acceleration Due to Gravity

Velocity Test: Interpreting Velocity Graphs HSF.IF.C.7

Figure from experiment 12 from Real-World Math with Vernier

Students are notoriously difficult for teachers to engage in a lesson. With Vernier, teachers are able to use lessons on quick notice that involve technology and student attention. With technology, students become excited about something different in the classroom and are therefore more attentive. With Vernier, there are numerous different technologies with hundreds of ideas for lessons (not exclusive to math if you are a science teacher-or if you are a math teacher wanting to introduce some science into your lesson!). The product used in this lesson is the Motion Detector, which can be acquired through https://www.vernier.com/products/sensors/motion-detectors/md-btd/. This sensor is designed to collect data from the distance between the sensor and what it is pointing at. There are Image result for speednumerous more lessons involving it, and is especially useful for any movement-based projects/lessons that a teacher plans to do.


This specific lesson deals with velocity. Students are assigned to record their distance and time with the Motion Detector. After they have that, they are to formulate a graph based on that data of their motion and compare/contrast that graph to the graph that the motion detector collected from their motion.

CCSS.MATH.CONTENT.HSF.IF.B.6
Calculate and interpret the average rate of change of a function (presented symbolically or as a table) over a specified interval. Estimate the rate of change from a graph.

CCSS.MATH.CONTENT.HSF.IF.C.7
Graph functions expressed symbolically and show key features of the graph, by hand in simple cases and using technology for more complicated cases.

Lesson: velocity-test-interpreting-velocity-graphs

Resources from vernier.com

The Next Great Question? HSF.IF.B.4

From calculating the size of the sun, to discovering the force of gravity on Earth, mathematics is a curious world that allows us to explore the greatest questions ever posed by humans. Today, do we find ourselves looking to solve the next great question? Look no further.
For in this math lesson, we will utilize the power of modern technology to explore the wondrous mysteries of gravity and how its unceasing force can drain the kinetic energy of an elastic object via contact force to ultimately convert all of the kinetic energy to potential form and thereby, halting the motion of the object altogether. Or simply put, we will deal with combining modeling technology with a hands-on activity involving a basketball to model the behavior of a basketball as it bounces when dropped from a given height.

vernier-activity

For this activity, students will be separated into groups of 3 or 4. They will each be given one basketball and one Vernier software package (which includes the motion trackers and calculators) to work with. Using the graphing software, students will create a model that depicts the behavior of a basketball when dropped from a given height. Using their graphs, they will then analyze it mathematically using their knowledge of quadratic functions. This activity requires students to have demonstrated mastery of quadratic functions.

Image result for graph of bouncing a ball

Common Core State Standards:

CCSS.MATH.CONTENT.HSF.IF.B.4
For a function that models a relationship between two quantities, interpret key features of graphs and tables in terms of the quantities, and sketch graphs showing key features given a verbal description of the relationship. Key features include: intercepts; intervals where the function is increasing, decreasing, positive, or negative; relative maximums and minimums; symmetries; end behavior; and periodicity.*
CCSS.MATH.CONTENT.HSF.IF.C.7
Graph functions expressed symbolically and show key features of the graph, by hand in simple cases and using technology for more complicated cases.*
CCSS.MATH.CONTENT.HSF.IF.C.7.A
Graph linear and quadratic functions and show intercepts, maxima, and minima.

This math activity requires physical and mental teamwork for adequate completion. Furthermore, this activity is designed to acknowledge students from all learning styles (visual, auditory, kinesthetic) in addition to creating an abundance of student discourse. The engaging nature of this activity makes it effective as it puts into physicality what students already have worked with and know about quadratic functions. To see the details of the activity, follow the link.

math-325-vernier-probe-modeling-activity-math-blog

Chill Out: Modeling with Exponential Functions HSF.IF.C.8.B

Have you ever burned your tongue when taking a big gulp of that hot drink you just got? This is something that almost everyone has experienced. This would be a relatable activity for students to participate in to determine how long it takes for a hot drink to cool down using the Vernier equipment and software.

Newton’s Law of cooling gives a model, which states that the temperature difference (Tdiff) between a hot object and its surroundings decreases exponentially with time. In the model T0 is the initial temperature and k is a positive constant.

Tdiff = T0 e-kt

In this activity, we will use a Vernier temperature probe to collect data as the hot water that the probe is placed in cools. This activity is applicable because after collecting the data, you can find the line of best fit for the data. By completing this activity, students will be able to see that modeling using regression lines of data is applicable to everyday events.screen-shot-2016-11-01-at-8-41-22-pmObjectives of this lesson:

  • Record temperature versus time cooling data
  • Model cooling data with an exponential function.

Equipment needed:screen-shot-2016-11-01-at-8-42-21-pm

  • EasyTemp or Go!Temp or Temperature Probe and data-collection software
  • TI-Nspire handheld or computers and TI-Nspire software
  • Hot water


Content standards:

CCSS.MATH.CONTENT.HSF.IF.C.8.B

Use the properties of exponents to interpret expressions for exponential functions.

CCSS.MATH.CONTENT.HSF.LE.A.2

Construct linear and exponential functions, including arithmetic and geometric sequences, given a graph, a description of a relationship, or two input-output pairs.

CCSS.MATH.CONTENT.HSA.CED.A.1

Create equations and inequalities in one variable and use them to solve problems. Include equations arising from linear and quadratic functions, and simple rational and exponential functions.


The Activity is from Vernier’s website: Chill Out Activity