Walk This Way – An activity that can be adapted for grades 5-11

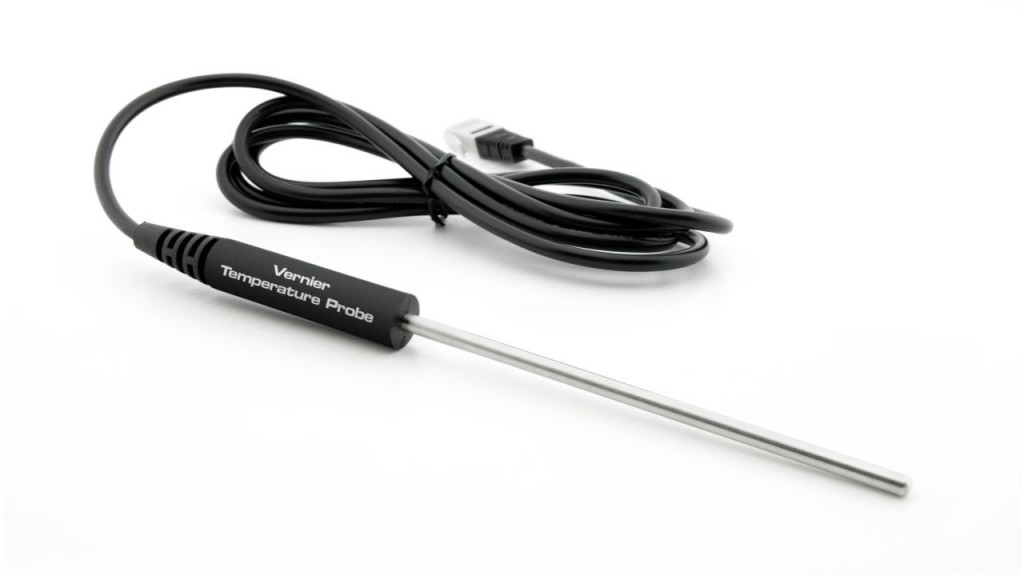
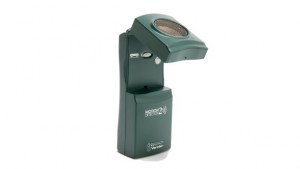
The Walk This Way activity uses a Motion Detector from Vernier and TI Calculators to connect student movement to graphical representations.

Notice each of the standards and cluster from the CCSS-Math.   

5.OA.B.3 Identify relationships between corresponding terms.

6.EE.C.9 Represent and analyze quantitative relationships between dependent and independent variables.

7.EE.B.4 Use variables to represent quantities in a real-world or mathematical problem, and construct simple equations and inequalities to solve problems by reasoning about quantitites.

8.F.B. Use functions to model relationships between quantities.

F-IF.A. Understand the concept of a function and use function notation.

A-CED.A. Create equations that describe numbers or relationships.

F-LE.B. Interpret expressions for functions in terms of the situation they model.

The Walk this Way activity includes both Lesson Guidelines and Student Handout.  Walk This Way – Lesson Guidelines

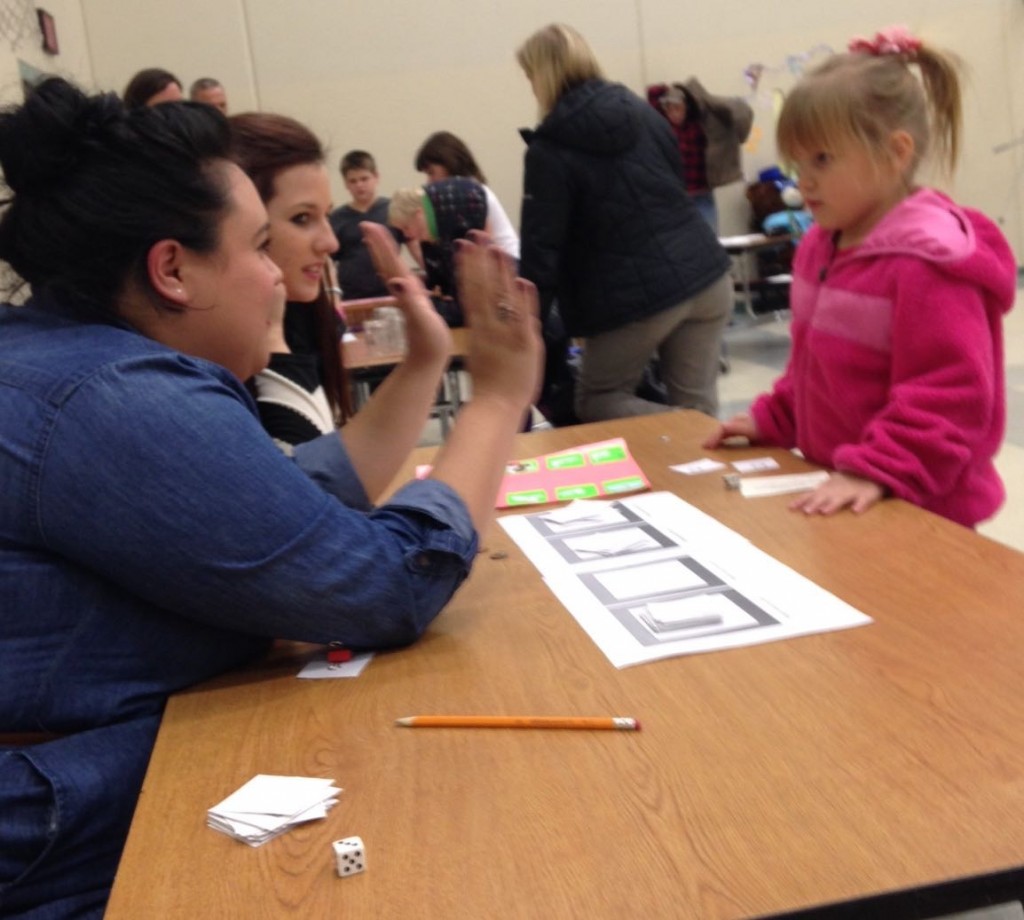
This activity engages students in modeling discourse – Student make and test predictions about graphical models of their classmates movement.

Screen Shot 2015-10-28 at 4.37.33 PMStudents work in groups of four: a. one person walks, b. another operates the calculator, c. another draws the graph on the calculator, and d. the graph of the peers walk, and the final person gives and writes the walking directions.  On the next walk the students switch tasks, so that everyone performs all tasks.

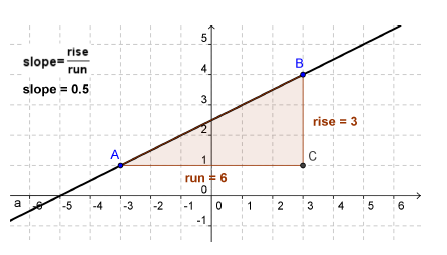
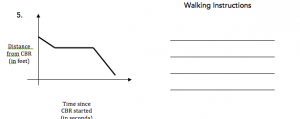
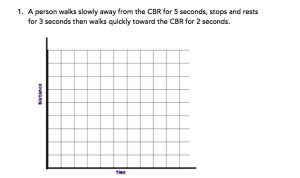
Students perform three different processes of modeling: Part 1. Physically walk from a graph given by the calculator (seen above); Part 2. Physically walk from a graph given on the work sheet (first two activities below); and Part 3. Draw and test a graph when given a walking story (final activity shown).

Screen Shot 2015-10-28 at 4.48.35 PMScreen Shot 2015-10-28 at 4.52.59 PMScreen Shot 2015-10-28 at 4.53.17 PM

Equipments Required

product.md-btd._hero.001.590.332TI- 83 or 84 calculator with Easy Data app (usually comes with the calculator)

Motion Detector from Vernier

6.EE – Healthy Heart

Students these days tend to lack exercise due to the constant use of technology. This real world problem engages students in a fun math activity that combines the use of technology with exercising. By monitoring their own heart rate students will have the opportunity to analyze the relationship between the dependent variable and the independent variables using graphs and tables, and relate these to equations that represent data applicable to real world problems.
On the livestrong.com website, Sarah Dray(2013) claims “Once you stop your workout, your heart rate should drop by about 20 beats during the first minute. People who have a reduction of 12 or less during that first minute are at a higher risk of suffering a heart attack later in life.” Are you at risk of suffering a heart attack later in life?

To have students answer this question they will need to monitor how fast their heart rate returns to normal after exercise with Vernier heart rate monitors and TI-84 graphing calculators.

http://www.vernier.com/products/sensors/hgh-bta/
As a class decide what type of exercise the students would like to partake in?(bunny hops, umping jacks, jogging in place, etc.)
After demonstrating how to use the technology. Have students break up into groups of four. The students should rotate taking turns monitoring their heart rate.
Students will see if their heart is in a health state by starting at rest, exercising for a minute, and then stopping and letting their heart return back to normal. Students will collect data of their heart rate every 10 seconds for the 2 minute period.
The common core standard of focus:
CSSI 6.EE.9 Use variable to represent two quantities in a real-world problem that change in relationship to one another; write an equation to express one quantity, thought of as the dependent variable, in terms of the other quantity, thought of as the independent variable. Analyze the relationship between the dependent variable and the independent variables using graphs and tables, and relate these to the equation.
To achieve the standard above have students make a table and graph of their data collected. Then with guided instruction have them write two equations. One equation reflecting how fast the heart rate accelerate during exercise and another equation reflecting how quickly the heart rate slowed during recovery.
To guide the student through the activity use the student handout attached and have the students fill out the handout as a group. By collaborating in groups they can learn how to respect each others thoughts and ideas, preparing them to be responsible citizens in a diverse society.
After the activity encourage students to bring their parents in during recess or lunch hour during the following day. Students can teach their parents how to use the equipment and test their parents heart health by monitoring the rate the parents’ heart recovers after a period of exercise.

Student Handout:
1. What is the independent variable?
2. What are the units of the independent variable?
3. What is the dependent variable?
4. What are the units of the dependent varibable?
5. What type of slope occurs when you begin to excersise?
6. What type of slope occurs when you let your heart rate return to its resting state?
7. What type of slope occurs if you just remain still.
Fill out the Table representing your heart rate. Make sure to include units
Time Heart Rate

Graph the the information on your table. Make sure to label your axis.

8. Write one equation reflecting how fast the heart rate acclerated during exercise.

9. Write a second equation reflecting how quickly the heart rate slowed during recovery.

10. Based on your data are you at risk of suffering a heart attack later in life? Explain.

8.EE – Cooling Off

Using Vernier Temperature Probes are a great way for teachers to integrate technology in their classroom. This project uses probes to measure the temperature of hot coffee and cold water and ultimately decides the perfect amount of cold water needed to enjoy your cup of coffee. Having the students complete this experiment to collect data will be more engaging for them compared to getting data from a textbook. Since students will be using their very own data, they will be eager to solve the given equation, which will strengthen the skills necessary to meet the learning target. That is because the students will solve the equation multiple times to answer different questions and the more practice they have and the higher their engagement level, the more likely they are to remember these skills.

http://www.vernier.com/products/sensors/temperature-sensors/

The questions asked in this assignment start simple, strengthening the students’ ideas and concepts of how all of the different temperatures and volumes relate to each other. As the students become more comfortable with the data, they are asked to apply their knowledge and equation solving skills to answer more difficult questions. Also, this project will be very memorable for the students and the teacher can refer back to it in future assignments so the students can recall the skills used to complete this task.

Many of the children have parents who drink coffee and undoubtedly, some of those parents probably burn their mouths. Students can actually apply these skills at home and determine how much cold water their parent(s) should add to make their coffee more enjoyable.

Here is assignment sheet needed to complete the experiment Vernier Probes Cooling Off

http://www.vernier.com/experiments/rwv/6/mix_it_up_-_mixing_liquids_of_different_temperatures/

8.EE.B / 8.F.A. / HSA-CED.A Time to Sell Some Cars

With this problem, students are able to see an example of a real-world situation and understand how to answer a question about two different scenarios and see how they relate to one another.  It is important that students can see and understand that anything in the world can be related or traced back to math.  This is just one example.

Students in this lesson will have to understand proportional relationships between two linear equations then be able to create those equations from what they already know about what the equation for a line even looks like.  Students will be asked to graph their solutions in a table in order to see the comparisons of the two different car salesman and understand that even though an initial amount may be more than another, over a period of time the rate of change is more important to see who will make more at the end of the year.

Illustrative Mathematics Problem

6.EE – Solving Problems While Playing a Game

Racing Lincolns

Racing Lincoln

Standard:

CCSS.Math.Content.6.EE.B.7 Solve real-world and mathematical problems by writing and solving equations of the form x + p = q and px = q for cases in which p, q and x are all nonnegative rational numbers.

Preview Questions:

1. What is the order of operations?

2. What are the steps to solve an equation in the y=mx+b format if the   elements {m, x, and b} are given?

Purpose of Game: The purpose of this game is to help reinforce students understanding of solving equations with letter variables. The students will solve linear equations using the number they rolled on their dice as an x-input and the output will be either a negative or positive whole number.

Objective of Game: The objective of the game is to make it to the end space first!

List of Materials:

One penny for each player

A game board for each group

One dice for each group

A set of flashcards for each group

Scratch paper to solve problems

Rules:

  • This game can be played with 2-4 people.
  • The set of cards are shuffled and placed in the center of the table.
  • Each player chooses a penny as his or her game piece.
  • Each player rolls the dice to see who goes first.
  • Player 1 chooses a flashcard from the deck and rolls the dice. The player will solve the equation using the number on the dice as the x-input.  The y-output will be how many spaces the player moves on the game board.
  • If the player lands on a space with a red arrow, the player must move to the space that the red arrow indicates. If the player lands on a regular blue arrow, the player’s token stays on that arrow until their next turn.
  • If a player notices that a fellow racer solved an equation incorrectly, the player can challenge their opponent and solve the equation correctly. The player that solves the equation correctly can move their token the correct amount of spaces and the player that answered the question incorrectly does not move their token.
  • The next player will do the same, and the players will repeat this process until one player reaches the end point of the board first.
  • The first person to reach the end first wins.

Modeling Example:

Teacher: We are about to start a round of Racing Lincolns—in this game each of you will be given a different colored penny as your token, the first penny to reach the end of the board will win. I will play a turn for all of you to show you how to play.

Teacher: First I am going to pull a flashcard to see what equation I will need to solve. I have just pulled a flashcard that reads “y=2x-3”, and I have just rolled my dice and the face reads five. Once I solve the problem I see that my solution is seven, which means that I get to move my penny token to the seventh spot on the game board.

Teacher: If I was playing in a group all of my partners would do the same and we would continue until one of us reaches the end point on the game board.

Teacher: If all of you have your game pieces and understand how to play then you are all set to get into groups of two to four and play the game.

Teacher: May the best Lincoln win!

Adaptation:

1)    For older students, the flashcards will be in quadratic form.

2)  For younger students, the  flashcards will be in the format “3 + ____ = ?” instead of in y=mx+b format. The flashcards would only have a positive output.

Follow-up Questions:  

               Complete the Racing Lincolns Pit Stop worksheet.

 Lesson plan with Worksheets

7.EE-Calculating Wages and Tips

 7.EE-Solve multi-step real-life and mathematical problems

Algebra:

CCSS.MATH.CONTENT.7.EE.B.3
Solve multi-step real-life and mathematical problems posed with positive and negative rational numbers in any form (whole numbers, fractions, and decimals), using tools strategically. Apply properties of operations to calculate with numbers in any form; convert between forms as appropriate; and assess the reasonableness of answers using mental computation and estimation strategies.

Problem:

Joe works at a concessions stand at Century Link Field. Joe makes $10 per hour plus any tips he gets from the generous football fans. Set up and solve an equation for EACH of the given problems and write your answer using complete sentences.

  1. Set up a general equation for the total amount of money Joe will earn working at the concessions stand. Define your variables.
  2. How much money does Joe make if he works 4 hours and makes $17 in tips?
  3. If Joe makes $86 dollars total, and earned $31 dollars in tips, how many hours did he work?
  4. Joe worked with Steve during the Seahawk v. 49ers game. They worked 6 hours and made $46 in tips together. If Steve and Joe split the tips evenly, how much money did Joe make during that game?

Commentary:

The purpose of this problem is to illustrate the Common Core State Standard of applying a real-world situation to learning how to set up and solve single variable equations. The students learned how to manipulate one and multi-step equations. Teachers can use this problem as a summative assessment. This problem gives them the chance to reason how to set up an equation using information that is provided for them. Students are able to define variables for an equation and use values to evaluate for the unknown variables. The students use the additive and multiplicative inverses to further their mathematical understanding of solving equations. The students will get a chance to change an equation so that it fits what a question is asking. For example, changing the original equation from T=10x+y to T=10x+(y/2) to factor in the tips being split. The story problem has multiple parts, so this gives the students the opportunity to read and follow directions carefully.

Solution:

  1. Let x be the number of hours that Joe worked, let y be the number of tips in dollars, and let T be the total number Joe earned in dollars. The student can pick any variable for the given information but the equation must be set up in the correct order. The number of hours worked must be multiplied by the wage, so 10x. Then the tips will be added to that making the entire equation T=10x+y.

x= number of hours worked

y= number of tips earned in dollars

T= total number dollars earned

T=10x+y

2. The number of tips, $17, should be plugged into y for the given equation.

T=10x+17

Then since we know that Joe worked for 4 hours, we can evaluate when x=4.

T=10(4)+17

T=40+17

T=57

            Joe earned $57 total.

3. The total number of money that Joe earned was $86 dollars and his tips were $31. For the equation the students must evaluate when T = 86 and y = 31. Then the students must solve the equation for x.

86=10x+31

55=10x

5.5=x

Joe worked for 5 and a half hours.

4. Since the amount of tips earned were shared by 2 people, the total number of tips needs to be divided by 2 to find Joe’s share.

T=10x+(y/2)

            Then evaluate the equation when x = 6 and y = 46.

T=10(6)+((46)/2)

T=60+23

T=83

            Joe earned $83 total.


6.EE-Using Algebra Touch to Simplify Algebraic Expressions & Equations Using Distributive Property

The Algebra Touch app gives students the opportunity to physically move numbers and variables around an iPad screen to better understand how to simplify algebraic expressions.  Students who are trying to solve algebraic expressions on paper out of a textbook have a hard time seeing what needs to be done first and the steps to simplify.  With this app, students get walked through the procedures and have visual aids to help them understand what is really going on mathematically.

In this lesson, students will learn how to solve different algebraic equations and simplify expressions with an emphasis on the distribution property.  Students are already knowledgeable of how to simplify algebraic equations and expressions by addition, subtraction, multiplication, and division.  Algebra Touch allows students to visualize the reason why the distributive property works.  Teachers can explain the distributive property with some examples on the whiteboard, but once the students get the opportunity to manipulate the different parts of expressions themselves on the iPad, it will deepen their understanding.

Algebra Touch Lesson Plan

Algebra Expressions and Equations Worksheet

(Video showing steps on how to distribute and factoring out using Algebra Touch)

8.EE-Using Geogebra to Model Slope

9_slope


Geogebra is one of the best modeling programs a math teacher can use. When trying to figure out new ideas for the classroom it can be difficult. A good way for new ideas is to integrate technology in to your lessons. Geogebra is a great free program that can be utilized by any teacher. When used correctly Geogebra can greatly aid any lesson and help your students fully understand the material. For a quick tutorial you can watch this video. http://www.youtube.com/watch?v=q2_FwCx83Jc

In this technology lesson plan I am modeling the slope of linear lines using Geogebra. I used Geogebra to show the class how the graph changes as the slope of the line changes. In Geogebra you can use a movable line to demonstrate this change. After students will do a worksheet about the relationship between the look, the slope and y-intercept of the graph. This will help students understand linear equations and how they are graphed. This lesson plan is great for students struggling with the understanding of linear lines and the way they look.


8.EE-Technology and Modeling Lessons that Enhance Student Learning

Driving to the Movies

Main-AB-Touch-ActivInspire-5-Stu

99% of the time teenagers’ favorite thing is friends and social life. This activity takes a normal social outing like going to the movies and helps students make sense of the problem from a mathematical perspective. The lesson is about relating cars speed to linear equations and finding the solutions of intersecting lines. In groups students will have to use knows and unknowns to make a model on ActivBoard Touch, which will appeal to kinesthetic and visual learners. The ActivBoard touch is like an interactive white board that serves as a collaboration zone for up to six students at a time.  Students use the model to solve the problem and see how changing different variables will affect the solution. Using a model to represent mathematics brings learning to life and increases student engagement. Students will feel empowered by being able to evaluate their own solution by physically seeing if their algebraic solution matches the graph solution represented in the model. I believe this lesson will effectively engage students in inquiry based learning since the scenario is relatable to their everyday lives. The Activboard Touch allows students to stimulate senses in the classroom that are usually kept lock away. This lesson allows students to visually see, engage, and then respond while effectively communicating with peers.

lesson plan for car problem cars worksheet

To hear case studies and success stories regarding using Activboard Touch to enhance student learning view this link:

http://www.prometheanworld.com/us/english/education/research/case-studies/#

To see how ActivBoard and how it can be used visit this link:

http://www.prometheanworld.com/us/english/education/products/interactive-whiteboard-systems/activboard-touch/

8.EE-Modeling Activity-SMART Board: helping solve systems of equations

This modeling activity can be useful for an Algebra teacher that wants to integrate technology in the curriculum. The central focus of this modeling activity is for students to gain confidence as they learn how to manipulate linear equations into slope-intercept form in order to graph the lines and find the solution. Since the modeling class size is small, about half of the students will be able to use the SMART Board, at a time, to help them reach the learning targets. Essential questions for students to answer during this lesson include:

  • What does a system of equations look like?
  • How do I graph a system of equations?
  • Can I graph an equation that is not in slope-intercept form?
  • How can I find the solution on the graph?
  • What does a written solution look like?
  • What is difficult about this method?
  • What do I like about this method?
  • When is this method best used?

Here is the detailed modeling activity plus the lesson plan :

Modeling Technology Explanation

Modeling Technology Lesson Plan

And here is a link to a video that can walk you through setting up a graph on the SMART Board: