Hit your mark! CCSS.MATH.CONTENT.HSS.CP.B.9

Dartboard


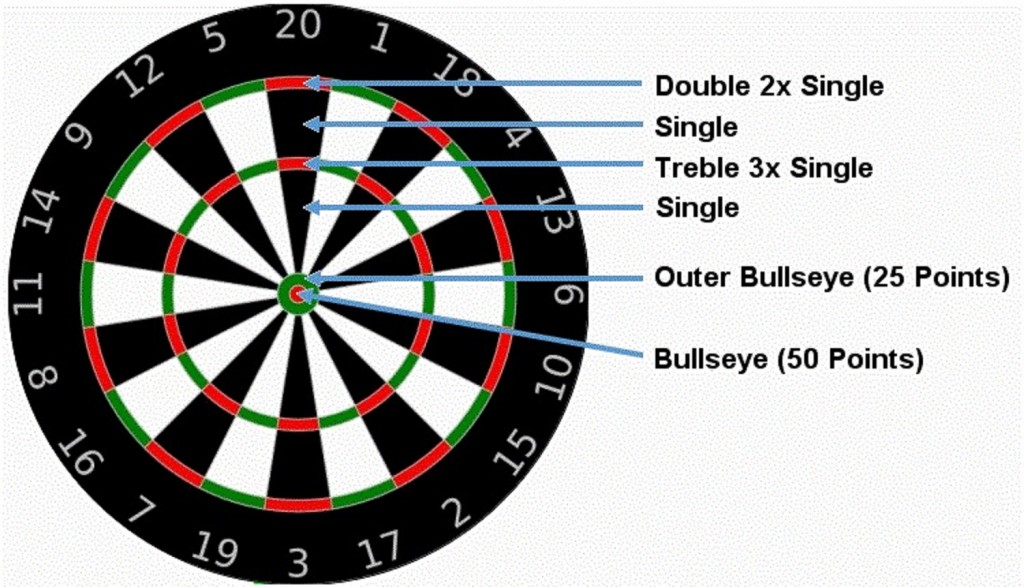
Darts is a game that everyone can have fun with, especially if you have a few friends to play with and make the game into a competition. But there is also a lot of math that can be done with the use of a dartboard. There is the simple math of adding your score, but I’m talking about something more complex than that. In this particular situation I am talking about probability.

CCSS.MATH.CONTENT.HSS.CP.B.9
(+) Use permutations and combinations to compute probabilities of compound events and solve problems.

What is the probability of hitting a bulls-eye? From the four darts you get to throw, and assuming all four land on the dartboard, how many different scores can you make and what are those scores? There are probability problems all over the board and this is a great way for students to have interactions and make math fun.

Fun With Probability – 7th Grade

This learning progression will be applied in a 7th grade mathematics classroom. The textbook being used throughout it will be; Core Connections – Course 2, by Dietiker, Kysh, Sallee & Hoey, specifically lessons 5.2.3-5.2.5. The common core state standards aligning with the lessons in the progression are:

  • CCSS.MATH.CONTENT.7.SP.C.8.A
    Understand that, just as with simple events, the probability of a compound event is the fraction of outcomes in the sample space for which the compound event occurs.
  • CCSS.MATH.CONTENT.7.SP.C.8.B
    Represent sample spaces for compound events using methods such as organized lists, tables and tree diagrams. For an event described in everyday language (e.g., “rolling double sixes”), identify the outcomes in the sample space which compose the event.
  • CCSS.MATH.CONTENT.7.SP.C.8.C
    Design and use a simulation to generate frequencies for compound events.

The following standards for mathematical practice are also included in the progression: MP1: Make sense of problems and persevere in solving them, MP4: Model with mathematics, MP5: Use appropriate tools strategically.

Multiple formative assessment techniques will be implemented in the progression to help students be more aware of their understanding and comprehension in relation to each of the standards and learning targets. Students are going to use learning logs throughout the learning progression and record personal entries summarizing their own understanding of the learning targets relative to each lesson. Also, exit slips/hinge questions will be used at the conclusion of each of the first two lessons of the progression as pre-cursors towards the next.

A sample instructional task that will be taking place in this progression is constructing probability tables through the use of an interactive game that students are sure to love! Attached is the complete learning progression including a narrative and complete activities/assessment tasks.

Learning_Progression_7th

Hunger Probability Games CCSS.Math.Content.7.SP.C.8

Hunger Probability Games CCSS.Math.Content.7.SP.C.8

Megan Kriete, Christine Godfrey, Eric Zils

numbers1-20

Welcome to the Hunger Probability Games! There will be 6 of your students randomly drawn to be picked for the ultimate Mathematics show down. Once your students number is picked that student cannot be drawn again. Let the games begin! Then students will find the probability of their number either drawn or not drawn in the activity. This activity is a lesson for the students to find probabilities of compound events using a program in the TI-84 Graphing calculator and a tree diagram.

This is a statistics and probability activity. The problems in this activity have numbers which do not repeat. This lesson will be the second lesson in a four-lesson unit. Using a procedure to write probability problems containing non repeating numbers. The probability problems are using drawings and/or manipulatives to solve real world problems by using an algorithm or technology. The mathematics content addressed in this learning segment is Common Core State Standard CCSS.Math.Content.7.SP.C.8 Find probabilities of compound events using organized lists, tables, tree diagrams, and simulation. For example, how many ways could the 3 students, Mark (A), Janet (B), and Teri (C), come in 1st, 2nd and 3rd place? Solution: making an organized list will identify that there are 6 ways for the students to win a race {A, B, C} {A, C, B} {B, C, A} {B, A, C} {C, A, B} {C, B, A}.

For the students who are English Language Learners (ELL), they will be allowed notes describing any terms in their native language. For all students the terms and algorithms will be defined/described on the whiteboard so they may construct their own mathematics dictionary. The visually impaired student will be given the definitions/descriptions/notes (algorithms) in large print or in braille through special education services. For students who have demonstrated that they have not yet mastered the sixth grade Common Core State Standard of recognizing statistical questions, displaying data and summarizing data sets they will receive additional help/tutoring outside of class. Students who have difficulty visualizing probabilities abstractly or with the technology will be given manipulatives.

Scaffolding Procedures

  • Students will use previous and current vocabulary and mathematical strategies in this lesson, such as factorial.
  • Students will use technology to gather data in order to fill in the probability table used to record their chances of having their number drawn in the game.
  • Students will then use the data they gathered to draw a diagram representing the data.
  • After “X” amount of time the teacher will show students how to represent the data with a tree diagram.
  • Students will then apply the table and tree diagram for the use of answering the question portion of the activity.
  • As homework students will then use this procedure to create and solve their own probability problem using coin(s).

Attachments: Lesson Plan and Activity Sheet (end of lesson plan): LessonPlan 1 Group.1

Calculator Directions: TI-84 Graphing Calculator


Ice Hands: Modeling a human histogram and box & whisker plot

Standard: High School: Statistics & Probability » Interpreting Categorical & Quantitative Data »                          Summarize, represent, and interpret data on a single count or measurement variable»                          Represent data with plots on the real number line (dot plots, histograms, and box plots).

In this post, teachers will learn how to incorporate the Venier Easy Temp Sensor into a statistics lesson. The lesson will be about histograms and box & whisker plots. Data for the histograms will be provided by the temperature sensor which uses Easy data on a TI 84/83 graphing calculator. The data will be collected on the calculator. The data will be shown through a projector in class, so that students are able to copy the data on to their worksheets.

Teacher will set note cards across the room with different temperatures in the class. Students will form a line from coldest to warmest hand temperature. Students will then make a human histogram. Teacher and students will discuss how a histogram’s data can be manipulated. This will give students a chance to figure out how histograms and bar graphs can be distributed. This will potentially will reduce the questions that students make when making a histogram (distribution): “Can I go up by two’s? Three’s? Five’s…etc.”

Teacher will then introduce the idea of a box & whisker plot. Then students with the assistance of the teacher will make a human Box & Whisker Plot and symbolizing with a rope. The Rope will be segmented according to the minimum value, lower quartile, median, upper quartile and maximum value. Teacher and students will explore the characteristics of a box whisker plot and histograms to ensure understanding of the upcoming lessons.


Teacher Notes on Worksheet

Student Worksheet

Vernier Easy Temp Sensor

Temperature Facts

7.SP.C The Great Race

Imagination your students comCompass2Campusparing a simulation of rolling two dice with horse racing.  In the attached worksheet student choose from a list of 12 horses. They are told that the number associated with their horse corresponds to the sums from rolling two dice.

 CCSS.Math 7.SP.C. Investigate chance processes and develop, use, and evaluate probability models.

ProbSim
figure 1

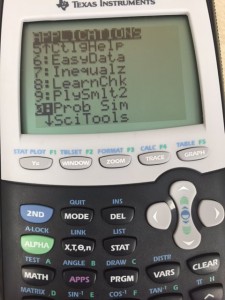
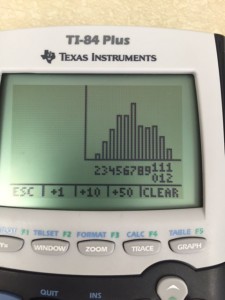
The powerful aspect of this activity is using the TI calculator app Prob Sim to simulate rolling two dice.  In figure 1, you can see how the students find the app Prob Sim.

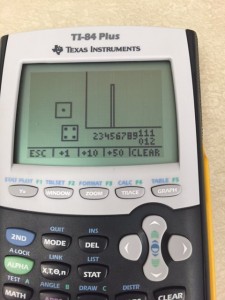
 In figure 2, notice that the simulation shows a picture of the two dices as well as records the sum on a histogram.

Rolldicesimulator
figure 2
ManyRollsDice
figure 3


In figure 3, 50 rolls at once can be used to reveal the pattern of probabilities that occur with a large number of rolls.

The worksheet, “The Great Race”, guides the students through individual or pair sampling to whole class horse racing with when 50 rolls at a time are recorded.  Students like to cheer for their horse when 400 to 500 samples are recorded on the histogram.  Finally the worksheet guides the students through organizing the 36 equally likely outcomes and discussing how the frequency of different sums influenced the chance of different horses winning.

The Great Race


CCSS.Math.Content.8.SP.A.1 Scattered Data

boys-playing-basketball3

Common Core State Standard for this lesson:

CCSS.Math.Content.8.SP.A.1-Construct and interpret scatter plots for bivariate measurement data to investigate patterns of association between two quantities. Describe patterns such as clustering, outliers, positive or negative association, linear association, and nonlinear association.

Instructions for activity:
• Read main question (Central Focus of the activity): How long does it take to pass a ball around in a circle while adding one more person to the circle each time around?
• Make a class prediction for how the data collected will appear.
• Number off students, assign placement of when to join the circle. One student will run stopwatch and record the times in table on worksheet.
• Start the activity with one person and time how long it take to pass the ball, repeat with two students, three student and so on.
• Record number of students and time in seconds
• Organize data in a table with number of students (n) being one variable and time (s) being the other.
• Students do Parts 2 and 3 in their small groups being prepared to discuss answers as a class.
• As a whole class disscuss answers.
Justification for modeling: See Mathematical Practice number 4.

.Tools: Ball, stopwatch, worksheet, paper, and pencil.

Vocabulary: Bivariate, variables, scatter plot, univariate, functions, and first differences.

Mathematical Practices for this lesson:

Practice 1: Make sense of problems and persevere in solving them.
Justification: Students can check that their answers make sense and are able to explain it.
Example: Students discuss Part 3 questions on worksheet in small group.

Practice 2: Reason abstractly and quantitatively.
Justification: Students can find and use the necessary information and are able to break apart a problem.
Example:In worksheet Part 3 questions are answered using the information collected/interpreted from Parts 1 and 2.

Practice 3: Construct viable arguments and critique the reasoning of others.
Justification: Students can use prior learning, make reasonable predictions, and use appropriate definitions and language.
Example: At the beginning of the activity when students are introducted to the activity.

Practice 4: Model with mathematics.
Justification: Students can apply what I know and show it in a mathematical problem, could draw graphs and tables, and reflect and revise on solutions and make changes as needed.
Example: The completing, collection, and using of data from Part 1 and 2 of the worksheet.

Practice 5: Use appropriate tools strategically.
Justification: Students can know the tools that are available and use them appropriately and use tools such as stopwatches and calculators.
Example: Data collection portion of Part 1 and answering of Part 3 question 5-7.

Practice 6: Attend to precision
Justification: Students can provide good explanations that are clear and precise, understand the vocabulary and their definitions, communicate, show their work and check their work.
Example: Completion in small groups of Part 3 of the worksheet and end of class discussion of Part 3 questions and Parts 1 and 2 data.

Practice 7: Look for and make use of structure.
Justification: Students will use patterns or structures to be able to see was to show the same objective or meaning, realize the relationship between the data collected, make predictions, use pictures to show numbers, draw conclusions, use vocabulary and formulas.
Example: Using intro, Part 1, and Part 3 of worksheet.

Practice 8: Look for and express regularity in repeated reasoning.
Justification: Students will explain to a partner how they got their answer.
Example: Part 3 of worksheet and class discussion.

This lesson/activity was a hit with the students, went well with my classroom environment and had minimal misconceptions.

Math 486 Lesson Plan

Scattered Data

Scattered Data Answer Key

Exit Ticket

Posted and Created by: Christine Godfrey, Andrea Hamada, and Megan Kriete.
 

Statistics and Probability 7th Grade CCSS.Math.Content.7.SP.5-8.

UntitledProbability and statistics all around us in the real world; therefore, these two concepts are essential for all math students to learn. This learning progression covers: Define and understand probability, Collecting data, then observing and predicting relative frequency, Probability modeling, Using uniform probability models to find probability, Observing frequencies to find non-uniform probability, Probability of compound events, Sample spaces for compound events, Design & use a simulation to generate frequencies for compound events, and teacher references filled with worksheets and activity aligned handouts for teaching each

of the concepts stated above. The learning progression is really tailored to students who learn better by working with their peers and enjoy hands-on activates. Attached along with this learning progression is a lesson plan that can be used to teach students the definition and basis of the term probability. This lesson includes a great game called Rock, Paper, Scissors, Chance Game where students work in pairs to solve if the game is rock, paper, scissors is truly fair? Haven’t you ever wondered? If you have, this lesson plan will show you how to use this activity to better address to students the definition of an event being equally likely and the essence of something being fair. This learning progression addresses the following common core cluster standards: CCSS.MATH CONTENT.7.SP.5-8.

Math 499E Learning Progression3

Learning Progression Lesson Plan1

7-SP Introduction to Probability

The grade level that the learning progression will involve are high school students in an Algebra B classroom. This is a group of students that are behind in algebra. This is why grade level 7 common core state standards are chosen. These students need more time for practicing new activities and more time to master new skills. The book used in this classroom is titled Algebra 1: Applications, Equations, Graphs. This textbook was published in 2004 by McDougal Littell, a division of Houghton Mifflin Company. This book is not used very much during class time. This learning progression will be for three probability activities. The first lesson will be an introduction of how to find probability and identify the likelihood of an event. Students will make a connection that if an event has a high probability, the event is more likely to take place. The second lesson will have students perform their own investigation of finding probability. Finally, the third lesson will have students create their own probability project. Students will use a real world application that can be used to collect data that relates to probability. The three Common Core State Standards that are used in the learning progression are

1. CCSS.MATH.CONTENT.7.SP.5..Understand that the probability of a chance event is a number between 0 and 1 that expresses the likelihood of the event occurring. Larger numbers indicate greater likelihood. A probability near 0 indicates an unlikely event, a probability around ½ indicates an event that is neither unlikely nor likely, and a probability near 1 indicates a likely event.

2. CCSS.MATH.CONTENT.7.SP.6. Approximate the probability of a chance event by collecting data on the chance process that produces it and observing its long-run relative frequency, and predict the approximate relative frequency given the probability. For example, when rolling a number cube 600 times, predict that a 3 or 6 would be rolled roughly 200 times, but probably not exactly 200 times.

3. CCSS.MATH.CONTENT.7.SP.7.a. Develop a uniform probability model by assigning equal probability to all outcomes, and use the model to determine probabilities of events. For example, if a student is selected at random from a class, find the probability that Jane will be selected and the probability that a girl will be selected.

The link to the learning progression and lesson plan are below.

Learning Progression Formative Assessment (1)


5-MD.1 The Slow Forty

The Slow Forty is a math problem found on Dan Meyer’s 3-Acts math task website. The link for this problem can be found from the first three words of the blog. The problem: How fast do you think Rich Eisen runs in miles per hour?

The Common Core State Standards for this problem are

CCSS.5-MD.1 

1. Convert among different-sized standard measurement units within a given measurement system (e.g., convert 5 cm to 0.05 m), and use these conversions in solving multi-step, real world problems.

CCSS.MP.4

Mathematically proficient students can apply the mathematics they know to solve problems arising in everyday life, society, and the workplace. In early grades, this might be as simple as writing an addition equation to describe a situation. In middle grades, a student might apply proportional reasoning to plan a school event or analyze a problem in the community. By high school, a student might use geometry to solve a design problem or use a function to describe how one quantity of interest depends on another. Mathematically proficient students who can apply what they know are comfortable making assumptions and approximations to simplify a complicated situation, realizing that these may need revision later. They are able to identify important quantities in a practical situation and map their relationships using such tools as diagrams, two-way tables, graphs, flowcharts and formulas. They can analyze those relationships mathematically to draw conclusions. They routinely interpret their mathematical results in the context of the situation and reflect on whether the results make sense, possibly improving the model if it has not served its purpose.

The first video is about 15 seconds long and in the video you see Rich start running at the 0 yard line (The Goal line) and you watch him run to the 40 yard long. In the video you are also given the amount of strides Rich takes. After the video students are asked to answer the following questions:

  • 1. How fast do you think Rich Eisen runs in miles per hour?
  • 2. Write a guess.
  • 3. Write a guess you know is too high.
  • 4. Write a guess you know is too low.

Students will the have either a group or classroom discussion about their answer and give reasons to support their answers. Students will then be asked to come up with a solution that they all agree on and a possible equation to support their work. After the students have agreed on a speed for Rich they will then watch an 8 second video with the correct answer of Rich’s speed. After watching the video students will then discuss the following questions:

  • 5. Is your answer different from Rich Eisen’s fastest speed? Is it lower or higher? What could account for the difference?
  • 6. The World Almanac of Books and Facts reports a cheetah running at 70 miles per hour. How many seconds would it take a cheetah running at that speed to finish the 40-yard dash?

This lesson is a great way to get engaged in the group and/or classroom discussion because it gives each student a chance to state their own opinion on the answer and support other students in problem solving. One thing I would suggest students do to determine an equation to get the correct answer would be to start with what they know, and go from there. Maybe even have one student from each group run a short distance, determine how many steps the student took to get there, and how long it took. From there the students can create an equations that matches their information, to determine their speed and continue with the information from the video from there.

I have learned that students work better in small groups and work better when they can share their ideas with the class, that way if two students have the same guess, they can support each other to give reasons why they chose that answer. This is a way to build respect and rapport between the students and with the teacher.

S-MD.4: Money Duck 3-Acts Math Task

The Money Duck is a math problem found on Dan Meyer’s 3-Act math task website. The task first has the students watch a video about a soap bar in the shape of a duck with varying amounts of money on the inside. From there, students are then asked several questions about the possibility of the amount of money inside the duck, such as “how much would you pay for this duck?” The activity can be found using the following link:
http://www.101qs.com/2985

The Common Core State Standard that this problem addresses is “Using Probability to Make Decisions”. Furthermore, it focuses on S-MD.4 which states that students will “develop a probability distribution for a random variable defined for a sample space in which probabilities are assigned empirically; find the expected value.”

To get the students to meet the standard previously mentioned, I would first show them the video that was used on the Money Duck website. If the students have any questions about what the Money Duck is exactly, I would answer those questions before I began asking the students questions. The questions associated with this task will get progressively harder and more complex as the students work through them. The eventual destination is that the students will have an understanding of what expected value is, which is the main objective of the CCSS S-MD.4. This assignment requires that the students demonstrate their understanding of the identified CCSS in question 6 which asks “what is the expected value of each of the following distributions?” Students will have to use what they have learned and discovered in the previous questions as well as their understanding of probability to answer this question.

This lesson will prove to be engaging for the students because it involves videos and money. Also, I would make this a small group assignment so that students will be able to discuss ideas with group mates and then present their ideas to the rest of the class when we come back together. I would also ask other groups to respond each others answers, whether they agree or disagree, to better the entire class’s understanding of expected value.

Questions 1-5 will serve as a great formative assessment to see the students’ progress towards the learning target of being able to calculate expected value. These questions, as Dan Meyer described it, will be “setting the ball on the tee” for expected value so that the students will be able to answer question #6. #6 will serve as a benchmark assessment to see where the students are at in terms of CCSS S-MD.4. Depending on how far the hit the ball of the tee, whether it be a home run or they completely miss the ball, I can tell what the next step will be in terms of trying to meet that standard.