Build a playground 7.G.B.6 and MP4

By: Kimberly Younger, Rachel Van Kopp, Lizzie Englehart and Naomi Johnson

This lesson is focused on a 7th grade standard CCSS.Math.Content.7.G.B.6 but could be used for 6th through 8th grade depending on the application. This lesson focuses on the use of formulas to find area and problem solving of a real-world problem with the use of technology.

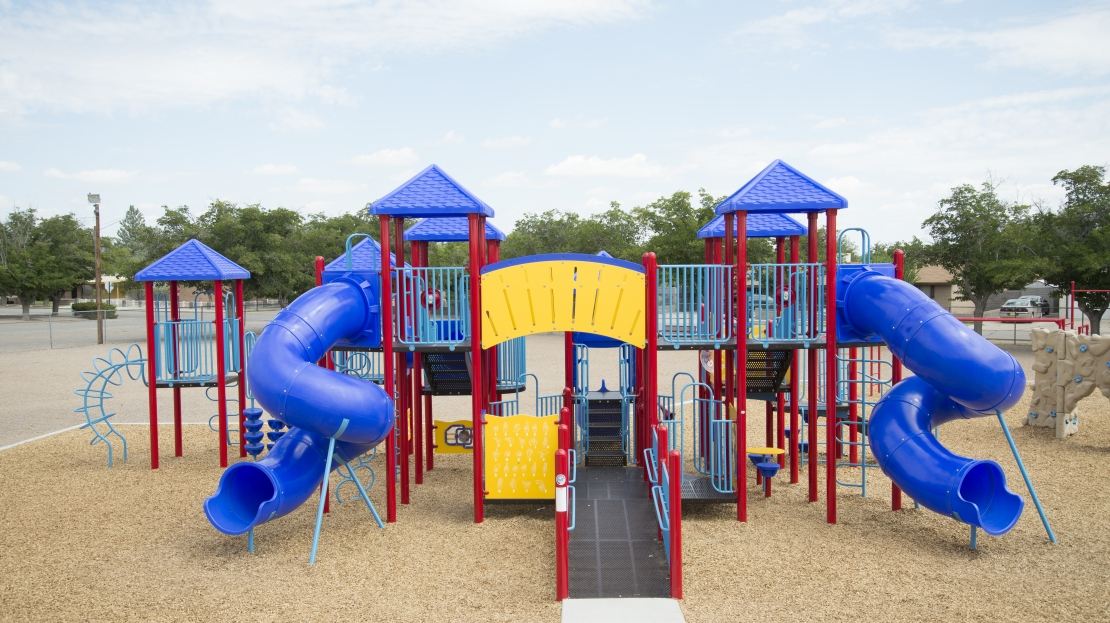
The prompt is “The school district is building a new playground for the new elementary school down the road. They have hired Playgrounds R’ Us to build it, but the supervisor wants to know what students would want on a playground. Create a playground with the following requirements.”

The students are building on their knowledge of area and perimeter formulas and applying it to a problem. The students are given a square footage for the playground, they must use three or more different shapes to represent their equipment, and the total square footage of the equipment must cover 30% of the playground’s area or more.

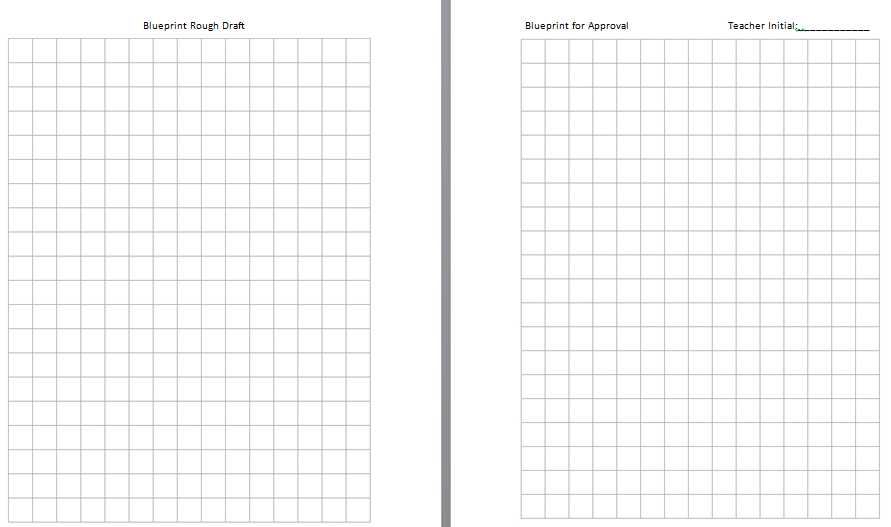
The students are given a packet which includes direction, a rough draft grid paper, final draft grid paper (submitted for approval), a screen shot of their Geogebra playground and a write up about their playground.

Below is an example of the packet students received. (link to the packet)

Below is a student’s sample playground

Rough Draft Blueprint                                Final Draft Blueprint                               Geogebra Blueprint
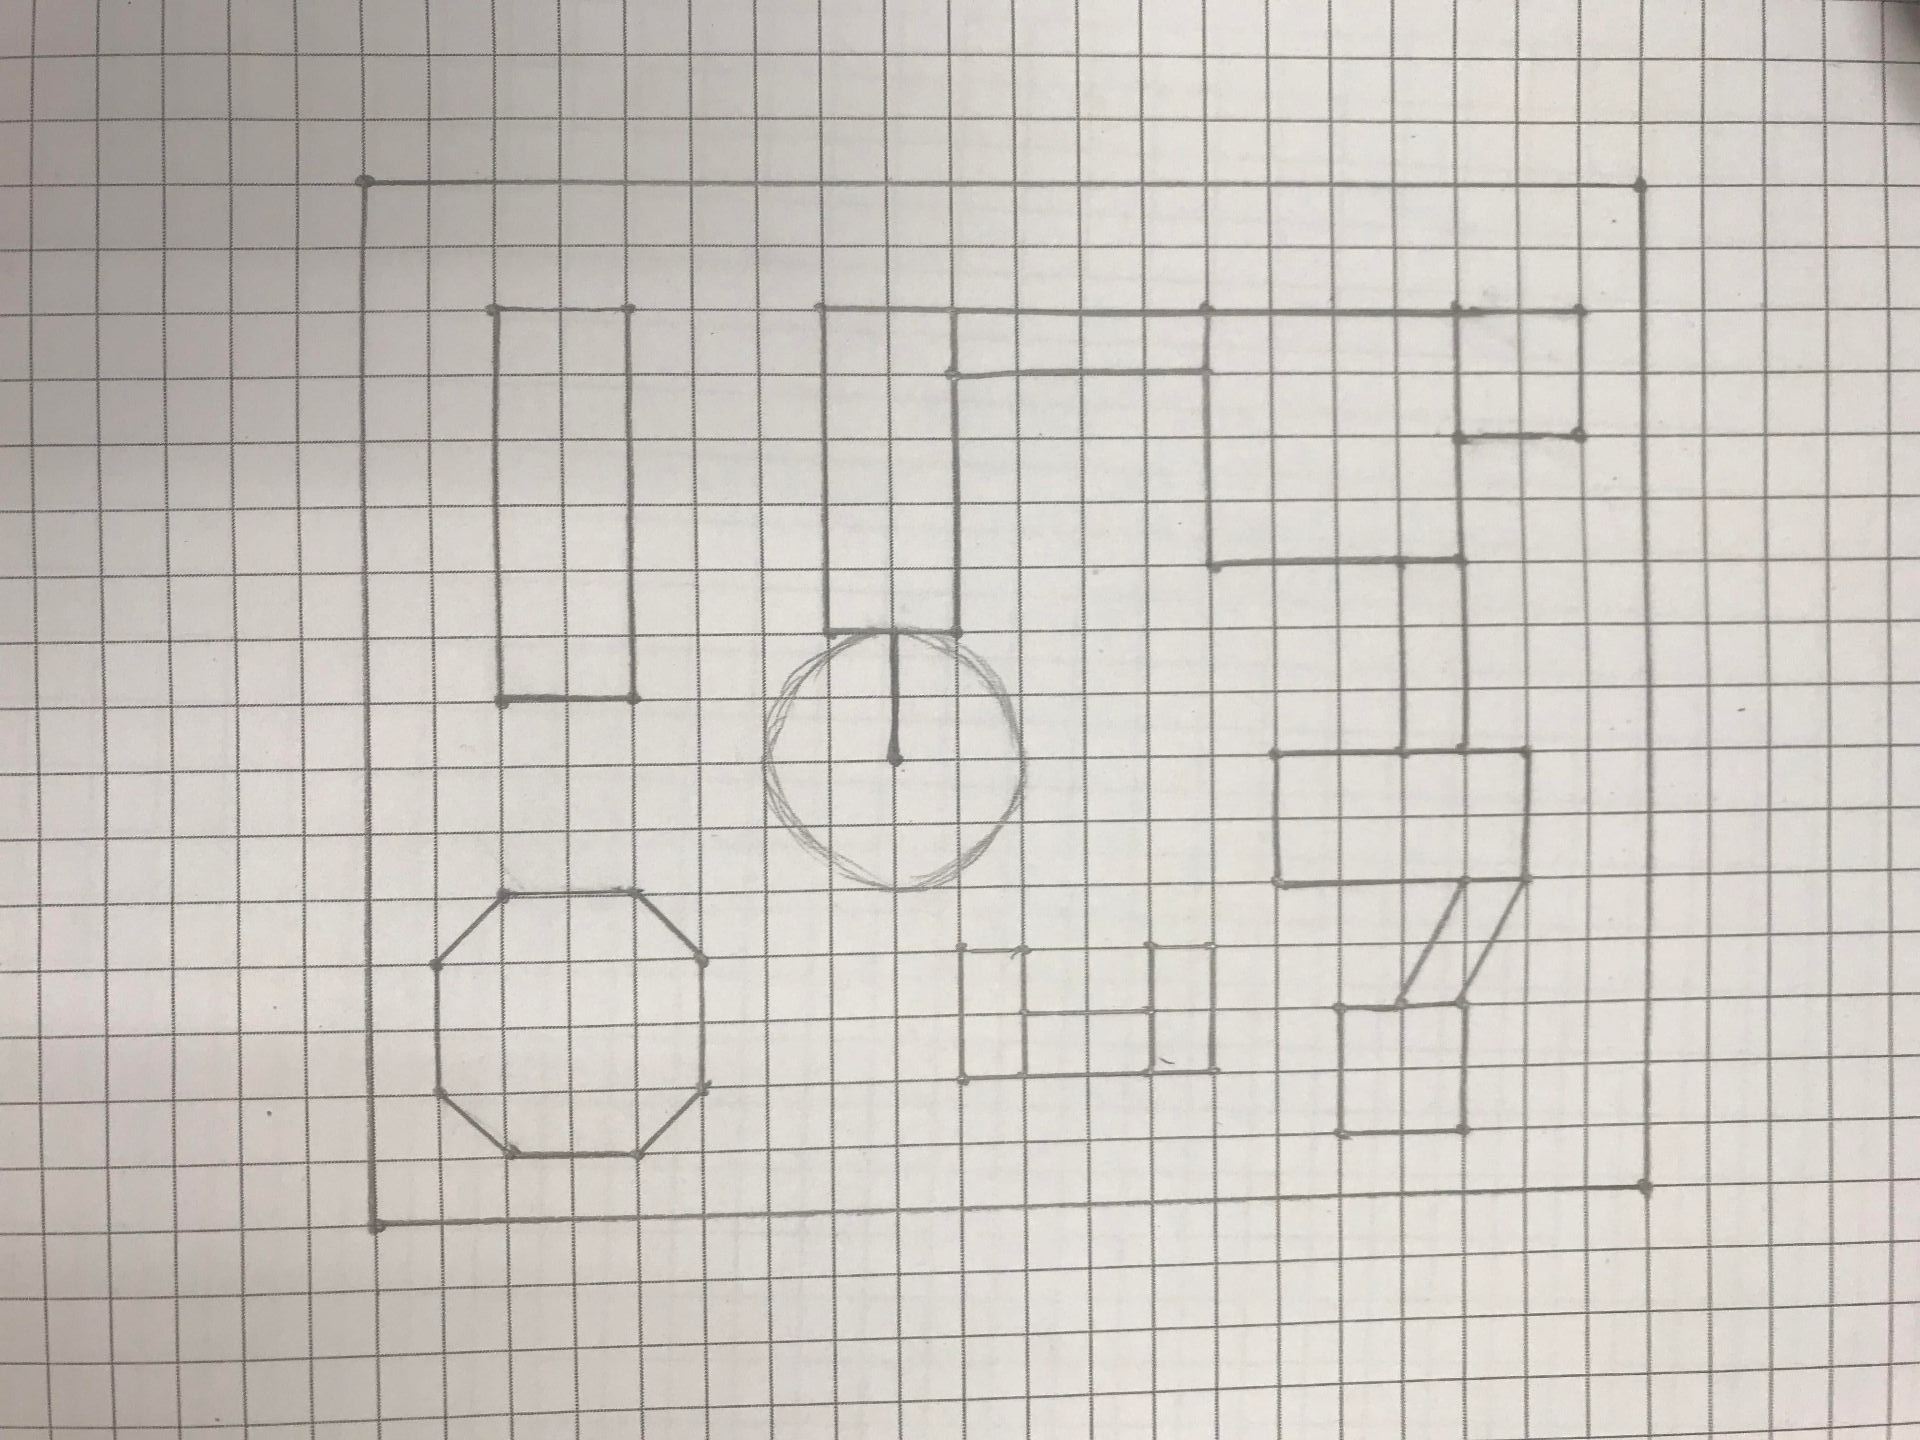
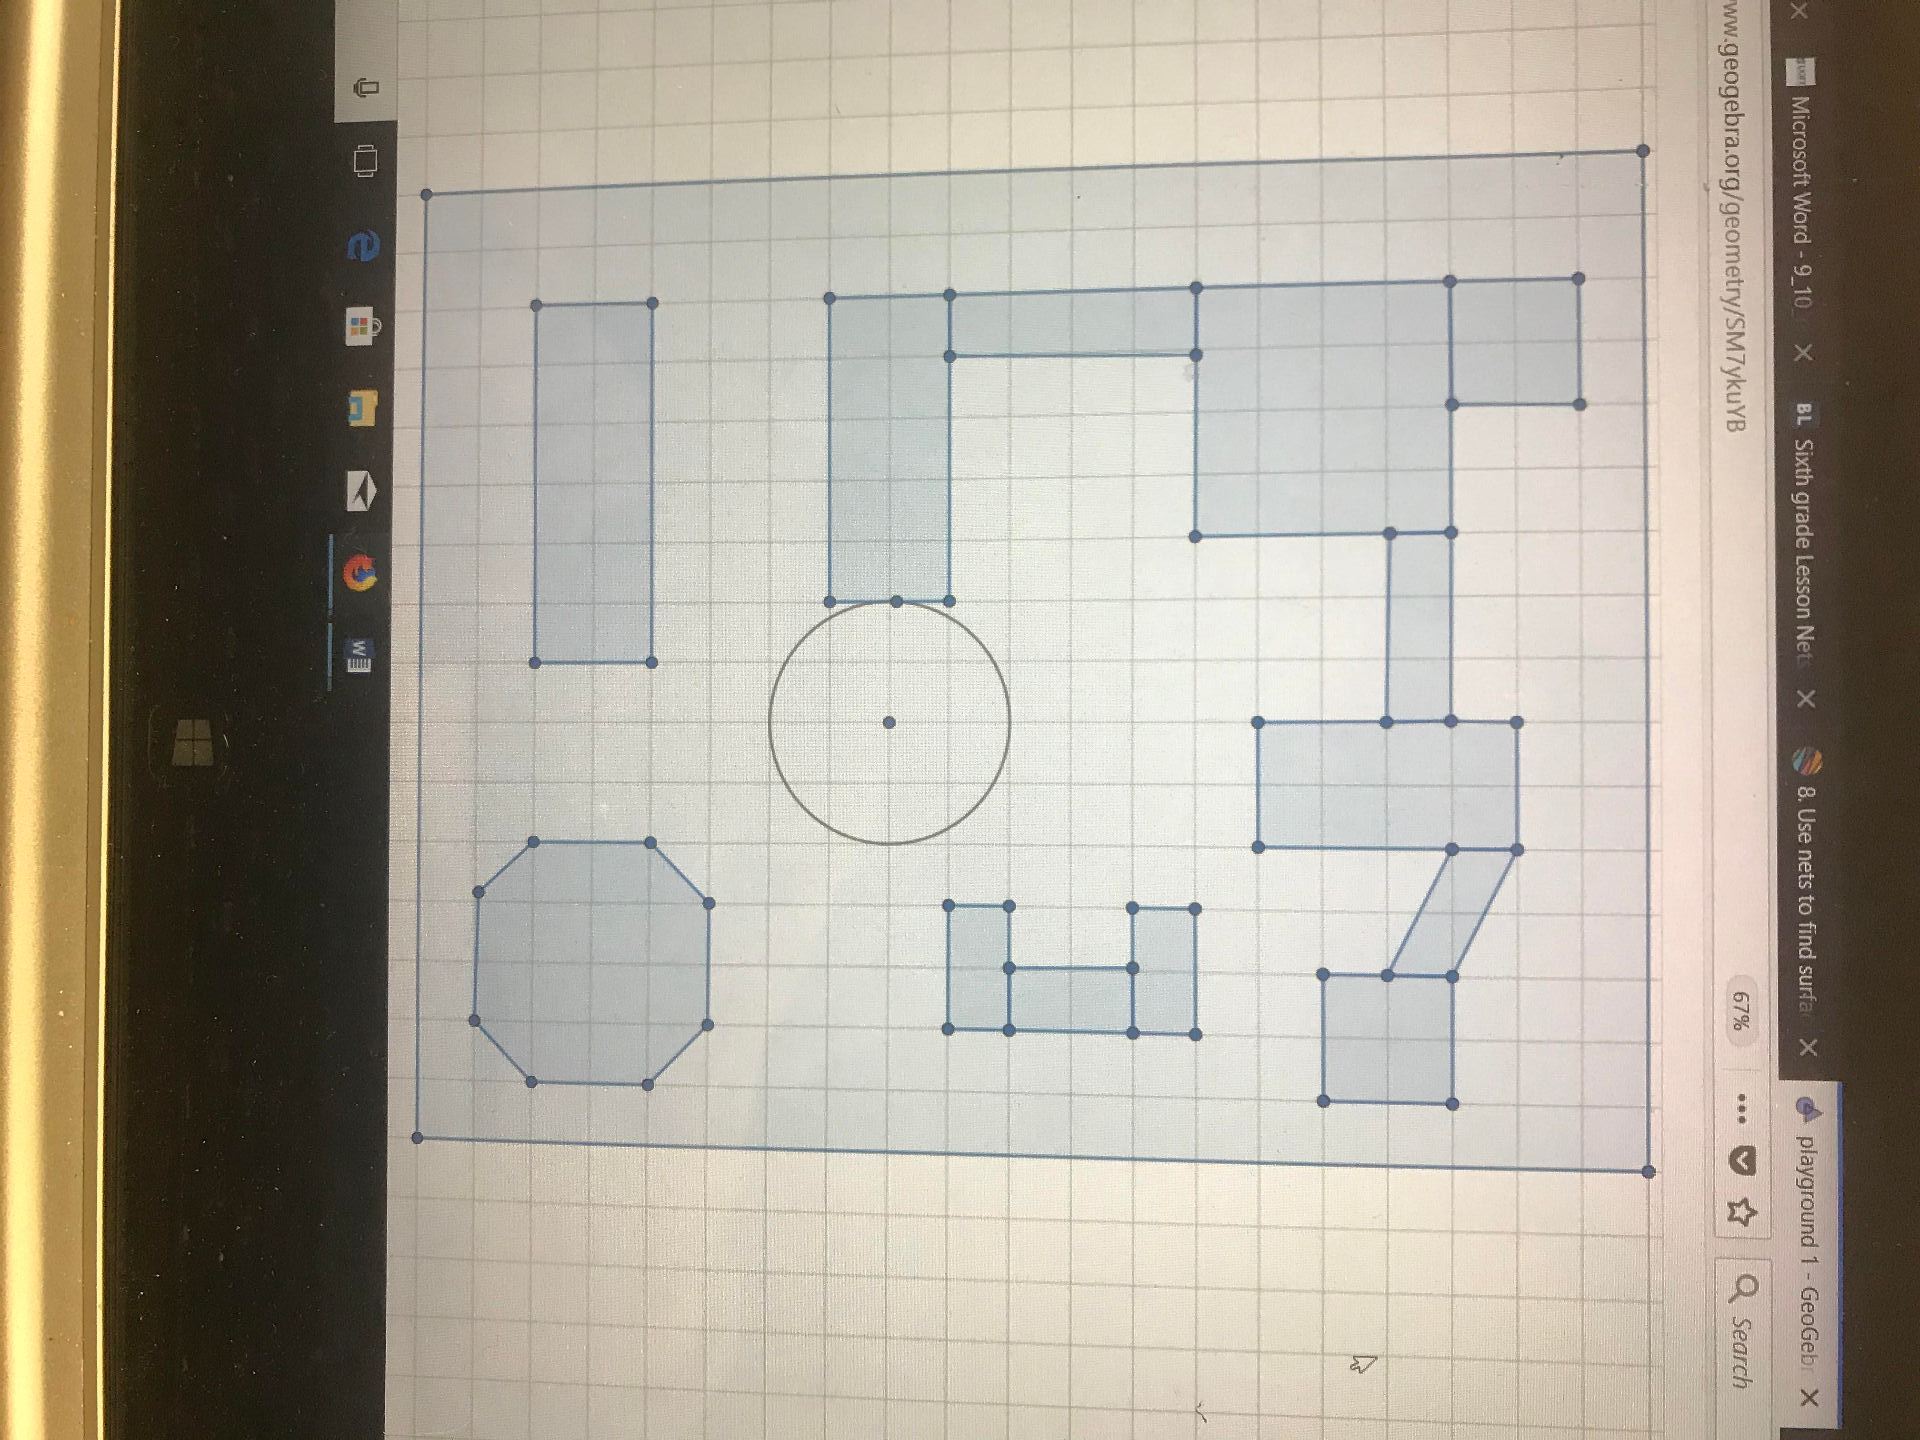
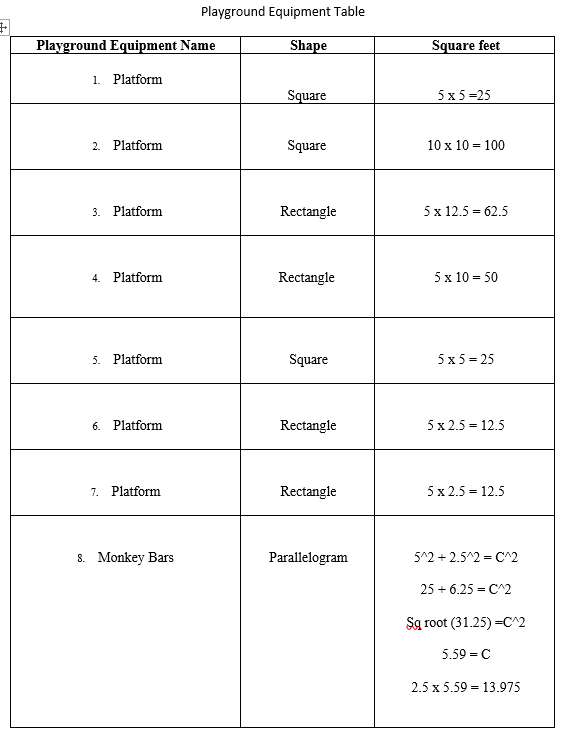
Table for Blueprint

Extension for “Build a Playground”:

As an extension to this lesson, students will later be able to work with 3 dimensional figures and nets to build the playground they have constructed in our lesson. This lesson emphasized finding and working with area of various geometrical figures and special reasoning. Using the knowledge, they have gained through our lesson, the students will be able to create the net that would best fit the equipment shape that they have presented to us on their “blue prints”.

In order to create the appropriate net, students will need to understand that the 3-dimensional shapes base will be the shape they have placed on their map in the lesson “Build a Playground”. This extension will cover CCSS.math.content.7.g.b.6 which states “Solve real-world and mathematical problems involving area, volume and surface area of two- and three-dimensional objects composed of triangles, quadrilaterals, polygons, cubes, and right prisms.” This extension will help students make connections to the relationships between 2-dimensional figures and 3-dimensional figures, and connect the concepts of surface area and volume to real-world scenarios.

Fence Fractions – 4.NF.B.3


Students are engaged in real world application of mathematical modeling when creating a fence using fractions that have unlike common denominators to add to make a whole. Tommy is building a fence and has one side length finished (1 whole) and needs help finding the other sides to his fence. The students will be given different fractions to analyze on geogebra–an online tool for students to use to help conceptualize fractions with unlike denominators. This lesson is designed for a 4th grade class modeling addition of fractions.  Students will be working individually to help Tommy create his fence.

Fence Lesson Plan-25objui

http://www.geogebra.org/m/ZrHpgCQv

What Does the Motion of a Rolling Object Look Like? HSF.IF.B.4

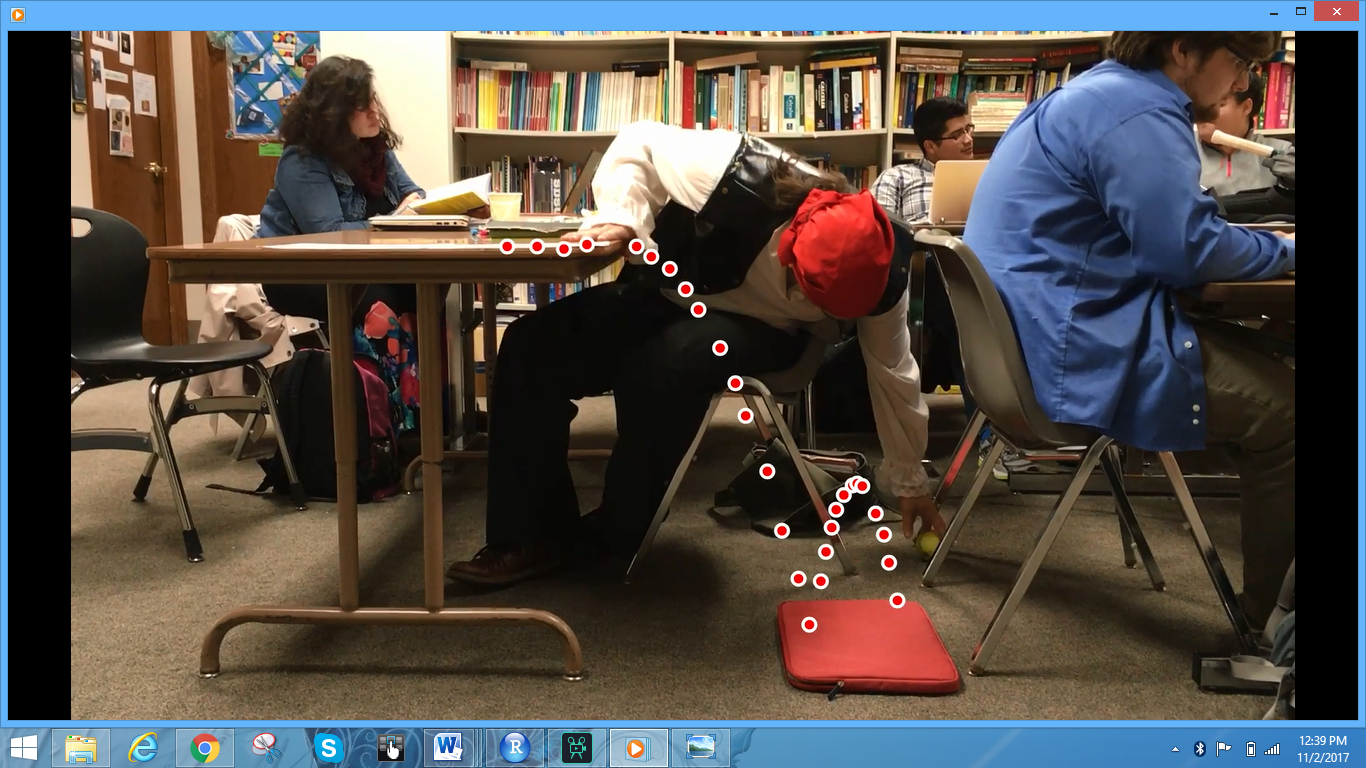
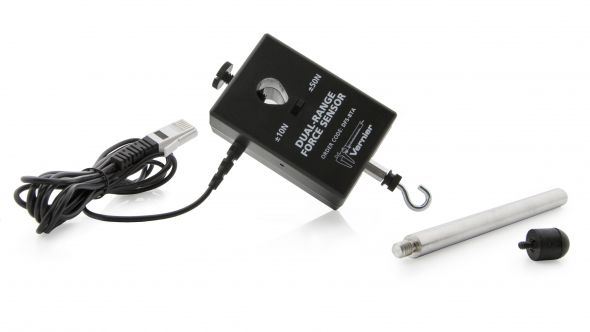
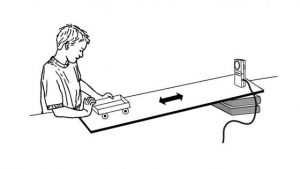
Students can get easily confused when it comes to understanding variables of a graph and visualizing what that information represents. This activity will allow students to see how the path of an object moving toward and away from a given point is modeled. With the use of their TI-84 Plus graphing calculators and the Vernier CBR-2, students in small groups will study the motion of a tennis ball and a toy car rolling up and then back down a ramp. This gives them an opportunity to practice interpreting  the motion of the objects through a hands on activity.

The graphs for the motion of either object should be similar in that they are parabolas, but students will be able to see what determines their properties. At first, they will be asked to visualize and sketch what they imagine the graphs would like. Then by using the technology explained, they can see how their original assumptions compare to the graphs obtained from the motion detector. This will encourage students to critically think about an object in motion and have a better understanding of how its distance from the starting point in relation to time is represented.

Activity Worksheet-Rolling Through Motion

Practice Standard:

CCSS.Math.Practice.MP5- Use appropriate tools strategically

This activity relates to the Common Core State Standard:

CCSS.Math.Content.HSF.IF.B.4
For a function that models a relationship between two quantities, interpret key features of graphs and tables in terms of the quantities, and sketch graphs showing key features given a verbal description of the relationship.

How does the slope change over time for a ball thrown in the air? F.IF & F.BF

This will be taught in a calculus class. Using the software and tools as shown in the following links: https://www.vernier.com/ https://www.vernier.com/products/software/lp/, the students will use the equipment to throw a ball in the air and track its position as time goes on. The students will use the data to draw a graph of position vs time for the ball and create an equation which give the position as it is related to the time. The students will then take the slope at different points and use the data to draw a slope vs time graph. They will also create a function for this graph. This will be an introduction activity to derivatives. The students will create a functions of the position vs time as well as create a function for the slope vs time. We will then go into covering the material for derivatives. The students will understand the procedure of how to create a function from a graph or data. They will also understand the concept of what a derivative is and how it relates to the real world problem I have provided. Below you will find the handout I will give the students to guide them through the activity.

The CCSS for this lesson are as follows:

  • CCSS.MATH.HSF-IF.B.4: Interpret functions that arise in applications in terms of context
  • CCSS.MATH.HSF-CED.A.2: Create equations that describe numbers or relationships.
  • CCSS.MATH.HSF-BF.A.1: Build a function that models a relationship between two quantities.


Ball Throwing Activity

Name:

Date:

  1. Set up your iPad such that it is far enough away to get a video of the ball as you throw it straight up in the air. You should make sure the ball stays in the view of the iPad when it is thrown for you should not move the iPad during the experiment.
  2. Open the Vernier Probes and Software program. Take a video of the ball as you lightly toss it straight up in the air.
  3. Sketch a graph of a position vs time for the ball in the space below. Create a function for this graph.


  1. Take the slope of the graph at t=0, at a point before the vertex, at the vertex, at a point after the vertex before the end, and finally at the point just before the ball hits the graph. What are the units of these slopes? What does this tell you about what the number means? Sketch a graph of the slopes as a time vs slope graph. Is it linear? What does that mean? Write an equation for the graph.


Hot Water vs. Boiling Water: Modeling with Linear Equations A.CED.A

A commonly asked question among students in math classes is “how will I ever use this in real life?” Math is extremely applicable to real world problems, but students do not always realize just how useful it can be.  For this reason, modeling real world, hands on problems is an extremely effective strategy to engage students in learning concepts, and it shows them the relevance of math concepts in the real world.  For this assignment, students will use Vernier temperature probes and a LabQuest2 to model and compare the temperature change of hot water and boiling water.

In this activity, students will use two temperature probes simultaneously to record the temperatures of boiling and hot water.  They will record the temperatures over the span of two minutes and use the LabQuest2 to generate linear equations for each cup of water (boiling and hot).  They will record the equation for each cup and graph the two lines on the same graph.  After recording their data, they will discuss and answer questions about the equations they found.  First, they will work with their partner to decide which cup of water is cooling faster.  Then they will compare the two lines and equations to determine whether the lines are parallel or intersecting and find where the two equations intersect.  Lastly, they will show their ability to create their own linear equation using two given points.  The students will display their understanding of the following CCSS by analyzing the real world data from the activity.

CCSS.MATH.CONTENT.HSA.CED.A.2
Create equations in two or more variables to represent relationships between quantities; graph equations on coordinate axes with labels and scales.

Vernier Probe Worksheet-2dfsi46

Weight Versus Time A-REI.B.3

How is the volume of water changing over time? When it comes to explaining volume and rate of change there are many possible ways to do this. By simply collecting weight data for a draining funnel students will be able to develop a model to illustrate the data collected. As the picture illustrate, it will be simple set up using a dual-range sensor to accomplish this lesson. 

The idea of the lesson is for the students to be able to understand rate of change and how it can be represented. Students will be able investigate using the proper equipment to answer questions such as at what rate is the water level decreasing? How long will it take for the funnel to drain completely?

Overall, students will be able to meet the objectives of recording the weight versus time data for a draining funnel and describe the recorded data using mathematical understanding of slope of a linear function.

Common Core State Standard:

HSA-REI.B.3. Solve linear equations and inequalities in one variable, including equations with coefficients represented by letters.

HSS-ID.C.7 Interpret the slope (rate of change) and the intercept in the context of the data.

HSS-ID.C.8 Compute (using technology) and interpret the correlation coefficient of a liner fit.

Disney World needs a new Roller-coaster! by Emily Ivie

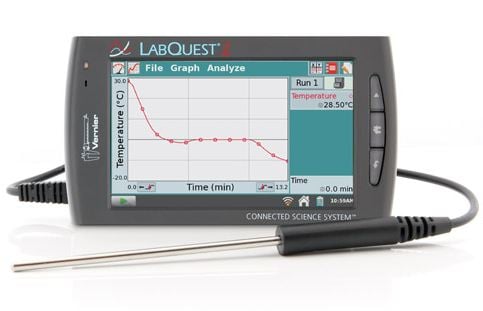
Learning Target – I will be able to use a motion detector to match and then create a time-distance graph. Represent two numerical variables on a scatter plot and describe any correlation and/or relationship between the two variables.

Common Core Standards: CCSS.Math.Content.HSF.IF.B.4, CCSS.Math.Content.HSF.IF.C.7.

Idea of the Lesson:

When students are introduced to the idea of slopes and rates, it is important to emphasize the application of slops and rates to the real world and the technology we can use to model this. The activity will help students connect the idea between slopes and roller-coasters. Then students will use a CBR, link cable, and graphing calculator with Easy data app downloaded to create a virtual roller-coaster. The benefit of this activity is that this is a real-world example of a job you can get with a math degree. The worksheet will be presented as a mathematician’s design of a roller-coaster. The students will also have to write up a conclusive “business proposal”.

Procedures:

  • Teacher will remind students of a time distance graph.
  • Create groups of 2 students each.
  • Students will draw their ideal roller-coaster with no flips (each student draws their own, does not need to match their partner).
  • Students will use CBR with calculator to create a simulation of their roller-coaster to match the slope while their partner runs the start/stop button.
  • Write up their business proposal using proper vocabulary

Activity’s worksheet

Circles and Squares: 7.G.B.4

By: Nick Spencer, Elizabeth Englehart, Sam Marcoe, and Grayson Windle

Introduction:

In Dan Meyer’s “Circles and Squares” video found at http://www.101qs.com/2859, we find a square and a circle on a number line ranging from 0 to 40.  We also notice that the sizes of the two geometrical figures change depending on their position on the number line, indicating some sort of relationship between the two shapes and their respective positions.


Group Findings:

The video raises several questions, including the obvious “What is this relationship?”.  Our group first began by trying to answer another question, “When are the areas of the two shapes equal?”  In the above screenshot of the video, we see that the circle and the square seem nearly equal in size in this position.  After some investigation, we found that the areas of the two shapes are equal when the distance from where the shapes touch and the end of the number line is 21.2 to the left and 18.8 to the right.  We were able to test this by visually seeing they are nearly the same in size at 20, and then by measuring the side length of the square and the radius of the circle with some guess-and-check methods.

To find the precise answer, however, we found that you could use the quadratic formula, as well as a couple of other ways through investigating.

Classroom Adaptation:

This problem can be used in a variety of grade levels, particularly in a middle-school classroom.  This problem utilizes algebraic, geometric, conceptual and problem-solving skills to solve.  Teachers can aim for their students to approach this problem in a variety of ways, depending on whether they want this to be an algebra-heavy problem or more of a conceptual experience.  This is a great example of a problem for students to practice the quadratic formula, but even better a problem for students to be able to find connections in mathematics, and use those connections to derive explanations for their findings.

CCSS:

CCSS.MATH.CONTENT.7.G.B.4

Know the formulas for the area and circumference of a circle and use them to solve problems; give an informal derivation of the relationship between the circumference and area of a circle.

Let’s Temp. Our Way Through Linear Equations HSA-CED.A.2

Math teachers are always wondering on how to use real world problems in any mathematical lesson. I think that a good way to do this is to do something that will get the attention of all students and do something they can all engage in. For this assignment we will be using the LabQuest2 and two temperature probes to measure the temperature of a cup of hot water using both Fahrenheit and Celsius.

Image result for dueling temperature probes labquest2

This will be done by connecting the two temperature probes  into channel 1 and 2 of the Labquest2. The students will then turn it on and go to the home button. They will then select the red temperature and make it Celsius and select the blue temperature and make it Fahrenheit. Once they do this they will get the cup of hot waterImage result for cup of water  and insert the probes inside then they will select the green arrow that will be shown on the bottom left hand corner of the screen to collect the temperatures for both Celsius and Fahrenheit. After 1 minute the students will stop the collecting the data by pressing the red rectangle. Then they will go to the analyze menu and select curve fit. Then they will select the red temperature and then click linear and write down their regression equation on the worksheet handed out to them for Celsius and then repeat for the blue temperature(Fahrenheit). The students who will be in groups of three will compare and contrast these temperatures graph them both on a piece of paper and then form a linear equation for both of the different scales. Then the students will use the information to tell whether the equations are the same, parallel, or intersecting and if they intersect where?
The assignment relates to the Common Core Standard
CCSS.MATH.HSA-CED.A.2 Creating equations that describe numbers or relationships

Lets temp our way through linear equations worksheet-pca5rc

How to Conceptualize Functions HS. FB

When students first see a set of ordered pairs, a table containing data, or a function representing this data, their first thought may be that these are just numbers on a page that are written in an organized way.  When this is a student’s first understanding of this information I believe that they are missing the point of the data.  Ordered pairs, tables of data and functions are really ways of graphing and representing real-world occurrences.  In this activity students will go from a real-world occurrence and will then decontextualize the results so that they can describe the rate of change of an object.  In this activity, students will take videos using an app produced by Venire, Video Physics, of the projectile motion of a ball rolling off of a table.  They will then take the points that they gather using the features of the app to find the average rate of change of the ball as it falls.  Students will do three trials of rolling the ball off of the table.  During each trial the students will change the amount of force that they use while causing the ball to roll off of the table.  After students have used the app to graph the motion of the ball, they will be able to use what they know about finding the slope between two points on a graph to notice the changes between the three graphs.  By connecting their procedural knowledge of how to find a slope between points to this real-world model of the mathematics, students will come to better understand how the mathematics that they are learning is truly a part of their everyday lives.

CCSS.MATH.CONTENT.5.G.A.2
Represent real world and mathematical problems by graphing points in the first quadrant of the coordinate plane, and interpret coordinate values of points in the context of the situation.

CCSS.MATH.CONTENT.HSF.IF.B.6
Calculate and interpret the average rate of change of a function (presented symbolically or as a table) over a specified interval. Estimate the rate of change from a graph.* 

CCSS.MATH.PRACTICE.MP4

Model with mathematics.

Venier worksheet