Bouncing Into Math CCSS.MATH.5.G.A.2

Some math teachers might ask the question “how can I adapt this curriculum to relate to real world scenarios?” One way to start is by taking an interest in what your students are interested in. There’s a time for lecture and there’s a time for, well, bouncing balls and having fun. This activity features measurement of a tennis ball bouncing and when it slows down, compared to a rubber ball bouncing and when it slows down, using the Ipad app called Video Physics. You might be asking yourself now “how in the world does this relate to the real world?” Well, once this activity is performed by questioning young minds, the students will want to know more. They’ll want to use the technology and math and relate it to people and if they were to keep jumping, at what point would those bounces become smaller and slower. This is an activity to get the students up out of their seats and “perform” mathematics in the classroom.

In this activity the students will need to get into groups of at least three and have an Ipad, a worksheet, a tennis ball, and a rubber ball. Each student will have his/her own job: recorder, video-taper, and ball bouncer. Each student will get to perform each task within the groups of three. The students will collect and record data pertaining to the tennis ball and the rubber ball and how each ball’s acceleration and height of the bounces differ slightly. Prior to the students gathering data, they will draw their prediction of what each ball’s graph will look like. This will give the students more insight to how the math aligns with reality. After they complete the worksheet given during this lesson, the class can discuss their findings as well as how else they could use this technology in their day to day lives.

This assignment relates to the Common Core State Standard

CCSS.MATH.5.G.A.2 Graph points on the coordinate plane to solve real-world and mathematical problems.

Bouncing Into Math Worksheet-1oj7bir

Crossover Between Exercise and Mathematics F.F-IF.4

Many students are not quiet about their opinions of a typical math class, one where the teacher lectures, the students write notes and there’s time at the end to work on the homework. While there may be a need for this sometimes, this is not the most efficient way to get students engaged in the class and the lesson.

An easy way to mix things up and increase student engagement is by implementing an activity, other than a basic worksheet to complete. With all the technological advances occurring all around us, it’s important that we expose our students to some of these new technologies especially when they relate to math.

Students learn best and engage when the activity and topics can be related to their life or daily activities. This is where the “Crossover between Exercise and Mathematics” activity comes into play. Even if not all students enjoy exercise, they are all familiar with it because they are required to take a certain number of gym credits in high school.

Image result for CBR 2
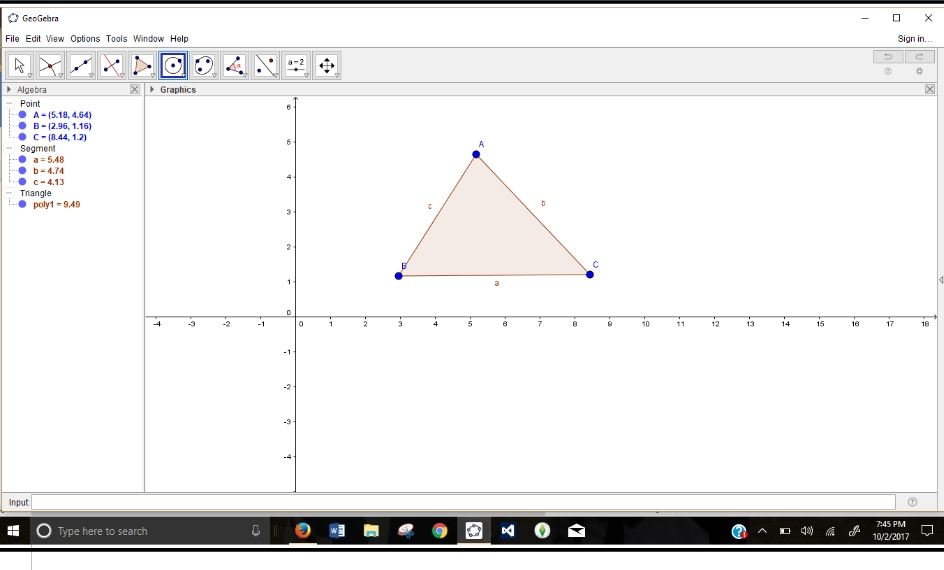
In this activity students are to use a Vernier CBR 2 Motion Detector with a compatible TI graphing calculator, either a TI-83 or TI-84. The students will work in groups of three to complete this math exercise activity. They will have to come up with an exercise were they can measure distance and amount of time while they are performing it.

The students will take turns with each person performing the exercise, operating the equipment, and recording the information on their worksheet.

Once the students have decided on the exercise to perform they will make a prediction of what their graph of distance over time will look like. The distance will be graphed on the y-axis and the time on the x-axis.

Once their prediction graph is drawn they will use the Vernier CBR 2 motion detector and TI graphing calculators to create a graph of the exercise. After using the software and getting the graph, the students will record the graph onto their sheet and explain the differences between their graph and the graph done by the software. They can also explain which aspects of the exercise are visible in each part of the graph. For example, if the exercise is pushups then the graph would go up and down and the peaks would be when the person is in the fully extended position of the push-up. And the down of the pushup would be in the valley of the graph.

This activity relates to the following Common Cores State Standard:

CCSS.MATH.HSF.F-IF.4

For a function that models a relationship between two quantities, interpret key features of graphs and tables in terms of the quantities, and sketch graphs showing key features given a verbal description of the relationship. Key features include: intercepts; intervals where the function is increasing, decreasing, positive, or negative; relative maximums and minimums; symmetries; end behavior; and periodicity.

Connection Between Exercise and Math worksheet

Where Will We Meet? REI.C.6

Solving Systems of Linear Equations

Standards for Mathematical Practice: Modeling with Mathematics

CCSS.MATH.CONTENT.HSA.REI.C.6
Solve systems of linear equations exactly and approximately (e.g., with graphs), focusing on pairs of linear equations in two variables.

In life, many things take more than one equation to figure out and solve. Things are not exactly the same as the next, particularly when it comes to speed. This math activity allows the students to use Vernier’s CBR-2 and be kinesthetically involved as they learn about what they are doing. The point of this assignment is to use the motion detectors and have their graphing calculators graph the motion of two walkers simultaneously. This will be done in a few different ways so they can see how it is useful to know this math. They will do some where one person is walking and the other person is going faster in an attempt to see where they can “catch up” to the first person. They will also do some where they are going different ways and see where they cross paths depending on the different speeds of the people.

Using the CBR-2 motion detectors will be helpful in keeping the students engaged because it is excited and they have to figure out where they will be crossing. There will definitely be some questions where they have to try and meet certain information like the placement of meeting or have one person at a certain speed. This uses the math practice of modeling which is good because they can use their information from physically doing it and being able to graph the information, then pull the specific data from the graph. The CCSS.MATH.HSA.REI.C.6 relates to this because it is about solving systems of linear equations which there are doing by seeing when their graph of their walking speeds intersect.


Shape Sorter 6.SP.B

By Rachel Van Kopp, Kimberly Younger, Tracy Van Lone, Natasha Smith, and Naomi Johnson

CCSS.MATH.CONTENT.7.G.A.3In the NCTM shape sorter activity, students use aVenn diagram to understand concepts of sorting geometric shapes by categories. For this activity our group of pre-service teachers sorted figures based on these parameters: 1. the figure has rotational symmetry and 2. the figure has at least one line of symmetry. Our group came up with two rules that we found to be true:

  1. All regular polygons have at least one line of symmetry
  2. All parallelograms  have rotational symmetry, but not a line of symmetry with the exception of the rectangle.

The following images are examples of attempts our group has made with the given categories.


Common misconceptions: Some common misconceptions with the categories has one line of symmetry and has rotational symmetry is that parallelograms have a line of symmetry. This is actually not true because no matter where the line is drawn on every parallelogram, except a regular trapezoid and rectangles, the angles will be off-set. Another misconception is that all figures with rotational symmetry have a line of symmetry. This is also untrue because parallelograms have rotational symmetry, but no line of symmetry.

To bring this activity in the classroom, we created a lesson warm-up and the worksheet pictured below, which can be download here. The warm-up (which is available via the link but not pictured) focuses students on relevant geometric vocabulary, and the worksheet serves as an activity tracker, helping students make connections between geometric concepts and sets and logic learning via their activity on the NCTM Shape-Sorter app.


Shape Sorter CCSS.Math.Content.6.SP.B.5.b

As students learn to classify shapes based on characteristics such as the length of the sides or the size of the angle, Venn Diagrams become effective tools. Illuminations, by NCTM, offers an easy to use online application for visually sorting polygons.  The app allows the user to pick one or two characteristics to sort polygons by, ranging from angle measures to side lengths and parallelism to symmetry.

After selecting one or two rules on the application, students then have the opportunity to shape pre-determined shapes into the correct category. The app has a “check your work” function (the check mark in the middle of the screen, see figure) that allows students to double check a shape if they are unsure of the answer. This ensures students have the correct understanding of vocabulary terms, such as what parallel lines or right angles are, as well as refining their understanding of complex statements such as “one or more” and “at least one”.

The application also offers a unique perspective for the student. Too often students learn the basic form for regular polygons, and rarely see variations. This resource has a number of polygons in irregular form that will help the students identify the variations. In addition, having a visual display of the different sets allows the student to contrast and compare the different shapes that apply to certain rules. This becomes an excellent opportunity for the student to identify patterns or additional properties that may be present among the shape. For example, in the shared image above a possible observation a student could reach may be “a 3-sided polygon will never have parallel sides”, or “the number of sides a polygon has is the same as the number of angles.”

Geogebra’s a Ka-HOOT

In this lesson, Geogebra and Kahoot will be used as our technology to better support the students in the class and hopefully to help them learn and remember the information well. Students can use the technology of Geogebra as they can move different points around and show that they understand how changing parts of a triangle changes the circumscribed circle without making multiple drawings. Kahoot is a good technology because it allows both the students and teacher to have instant feedback on how well the information was understood. It also allows the students to be having fun and working both with each other in groups and against other groups to win the most points.

CCSS.MATH.CONTENT.HSG.C.A.3

Construct the inscribed and circumscribed circles of a triangle, and prove properties of angles for a quadrilateral inscribed in a circle.

Geometry Using Techonology

ClassKick Keeps the Class Kicking!

Image result for classkick

Abstract:

ClassKick is a browser application that allows teachers to give assignments out digitally, and for students to ask for help anonymously. With ClassKick, teachers can easily create worksheets for their lessons that are accessible via a Class Code.  In acquiring this class 

Image result for classkick

code and putting it to use students are not required to provide their personal information. Students can work on an assignment at home or at school, and the teacher will receive real-time progress of their students. This technology also makes it possible for teachers to  track student work for multiple students at once.  Students are also able to ask their teacher and peers questions while working on their assignments and then receive immediate feedback. This also makes it possible for teachers to act upon student feedback more quickly during class time.


Resources:

CCSS.MATH.CONTENT.HSF.BF.A.1

Write a function that describes a relationship between two quantities.

Teacher Guide for Using ClassKick

ClassKick Article

Laser-Tag-Mania! CCSS.MATH.CONTENT.HSA.CED.A.1 andCCSS.MATH.CONTENT.HSA.CED.A.2

The story problem is about a game of laser tag where you have a certain amount of life points and you lose an amount of life points every time you get shot. The students will work in groups and as a group they will decide what they want their life point to be and how much will be lost per shot. Once they have decided that they will come up with an equation to model the situation. After they have their equation they go onto Geogebra and use it to graph their equation. Then each group puts their equation and graph on the white board and as a class we have a discussion about which equation students think would make the best game of laser tag and why.

CCSS.MATH.CONTENT.HSA.CED.A.1

Create equations and inequalities in one variable and use them to solve problems. Include equations arising from linear and quadratic functions, and simple rational and exponential functions.

CCSS.MATH.CONTENT.HSA.CED.A.2

Create equations in two or more variables to represent relationships between quantities; graph equations on coordinate axes with labels and scales.

LaserTagLessonPlan and Worksheet

To Infinity and Beyond CCSS.MATH.CONTENT.8.G.A.1 (A.B.C.) and 2, MP1 & 4

Are you ready to work for Pixar? To Infinity and Beyond is a technology-based math activity in which students interact with scenes from the famous Pixar movie, Toy Story. During this activity, students will be using their math skills such as translation, rotation, and scaling, to reconstruct scenes from the movie, in order to get approval from the director. Once the scene has been approved, the students can continue their learning, by answering the challenge questions after each section.

Attached below: Lesson Plan, and Student Worksheet

This lesson aligns with the the Common Core State Standards, the ITSE Standards, and the Math Practices:

CCSS.MATH.CONTENT.8.G.A.1 (A.B.C.) – Verify experimentally the properties of rotations, reflections, and translations: (A) Lines are taken to lines, and line segments to line segments of the same length. (B) Angles are taken to angles of the same measure. (C) Parallel lines are taken to parallel lines.

CCSS.MATH.CONTENT.8.G.A.2 – Understand that a two-dimensional figure is congruent to another if the second can be obtained from the first by a sequence of rotations, reflections, and translations; given two congruent figures, describe a sequence that exhibits the congruence between them.

CCSS.MATH.PRACTICE.MP1 –  Make sense of problems and persevere in solving them.

CCSS.MATH.PRACTICE.MP4 – Model with mathematics.

ISTE (3) Knowledge Constructor – Students critically curate a variety of resources using digital tools to construct knowledge, produced creative artifacts and make meaningful learning experiences for themselves and others.

ISTE (6) Creative Communicator – Students communicate clearly and express themselves creatively for a variety of purposes using the platforms, tools, styles, formats and digital media appropriate to their goals.

Group Project for Blog – Google Docs

To Infinity and Beyond

What’s Your Shape? CCSS.MATH.CONTENT.6.G.A.3


This is an interactive activity using the app Geometry Pad to solve the essential question: What shape do these coordinates make? This activity consists of students working with their peers to determine what shape they have based on simple coordinates. Students will present their prediction and justify the reasoning. To confirm the shape, they will use the app Geometry Pad under the document camera in front of their peers.

To find this app, visit the Apple App Store and search Geometry Pad. This app is only available on iPad.

Here is a sample lesson plan that applies this activity in a 6th grade class. Math 325 Math Blog Tech Lesson Plan

CCSS.MATH.CONTENT.6.G.A.3 Draw polygons in the coordinate plane given coordinates for the vertices; use coordinates to find the length of a side joining points with the same first coordinate or the same second coordinate. Apply these techniques in the context of solving real-world and mathematical problems.