Amusement Park 7.G.B

During this lesson, students will  be put to the test, using their prior knowledge from the previous geometry unit on two- and three-dimensional shapes involving area and perimeter.

You and your team have just been hired by Walt Disney Parks and Resorts Worldwide to landscape a brand new amusement park with rides. WDPR has provided you with a blank map with letters E through M, representing the nine rides that you must include in your design. Your task is to map out the most effective design in order to maximize the number of visitors to each ride. Your job is to gather all of the information you can, map out each ride using GeoGebra to graph your park, and present a justification as to why your design will maximize visitors to each of your rides.

In order to complete this lesson, students will be split into groups of 3-5. The class as a whole will have a set number of rides they must include in their park, and a set area for the park itself, but each group will devise different ride sizes and configurations throughout the map in order to maximize visitors to each ride.


Modeling Lesson-1xyl8m6

Build a playground 7.G.B.6 and MP4

By: Kimberly Younger, Rachel Van Kopp, Lizzie Englehart and Naomi Johnson

This lesson is focused on a 7th grade standard CCSS.Math.Content.7.G.B.6 but could be used for 6th through 8th grade depending on the application. This lesson focuses on the use of formulas to find area and problem solving of a real-world problem with the use of technology.

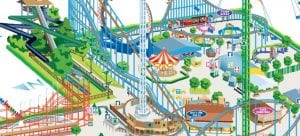
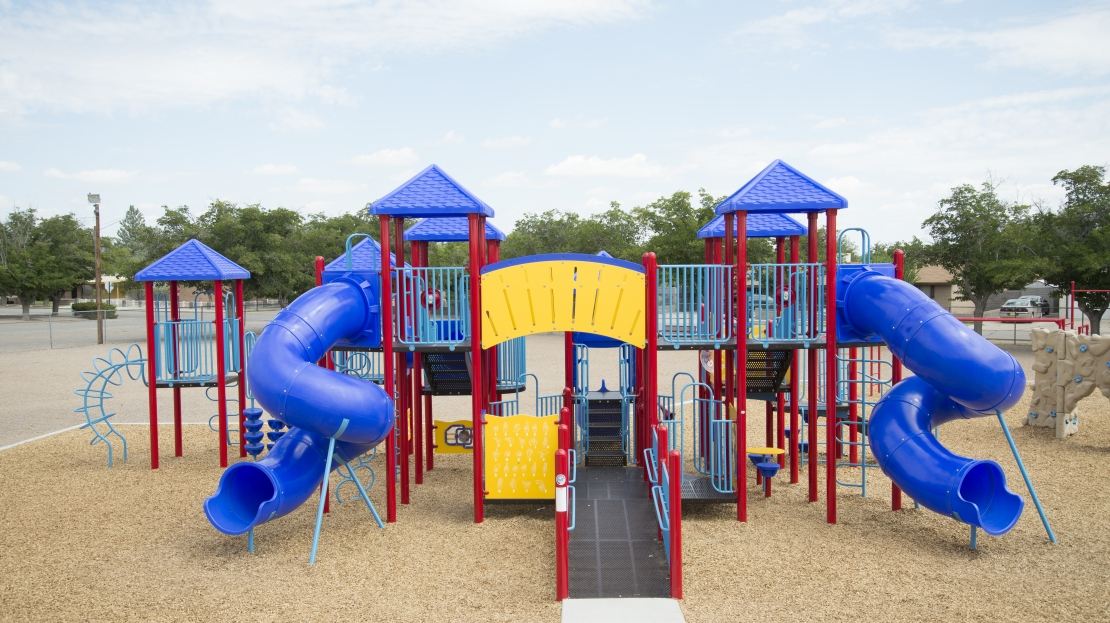
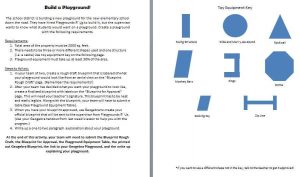
The prompt is “The school district is building a new playground for the new elementary school down the road. They have hired Playgrounds R’ Us to build it, but the supervisor wants to know what students would want on a playground. Create a playground with the following requirements.”

The students are building on their knowledge of area and perimeter formulas and applying it to a problem. The students are given a square footage for the playground, they must use three or more different shapes to represent their equipment, and the total square footage of the equipment must cover 30% of the playground’s area or more.

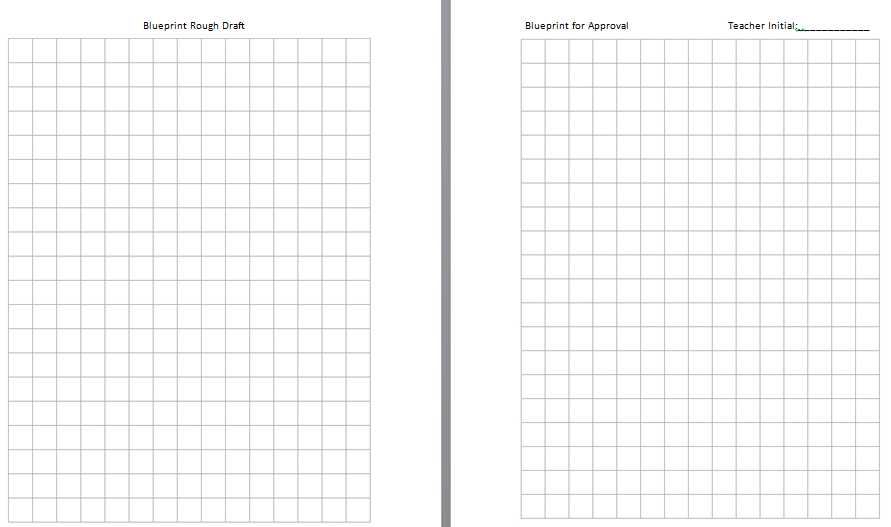
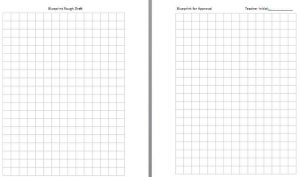
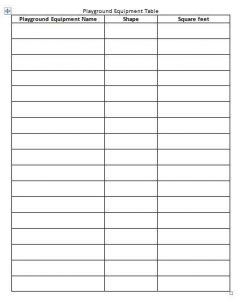
The students are given a packet which includes direction, a rough draft grid paper, final draft grid paper (submitted for approval), a screen shot of their Geogebra playground and a write up about their playground.

Below is an example of the packet students received. (link to the packet)

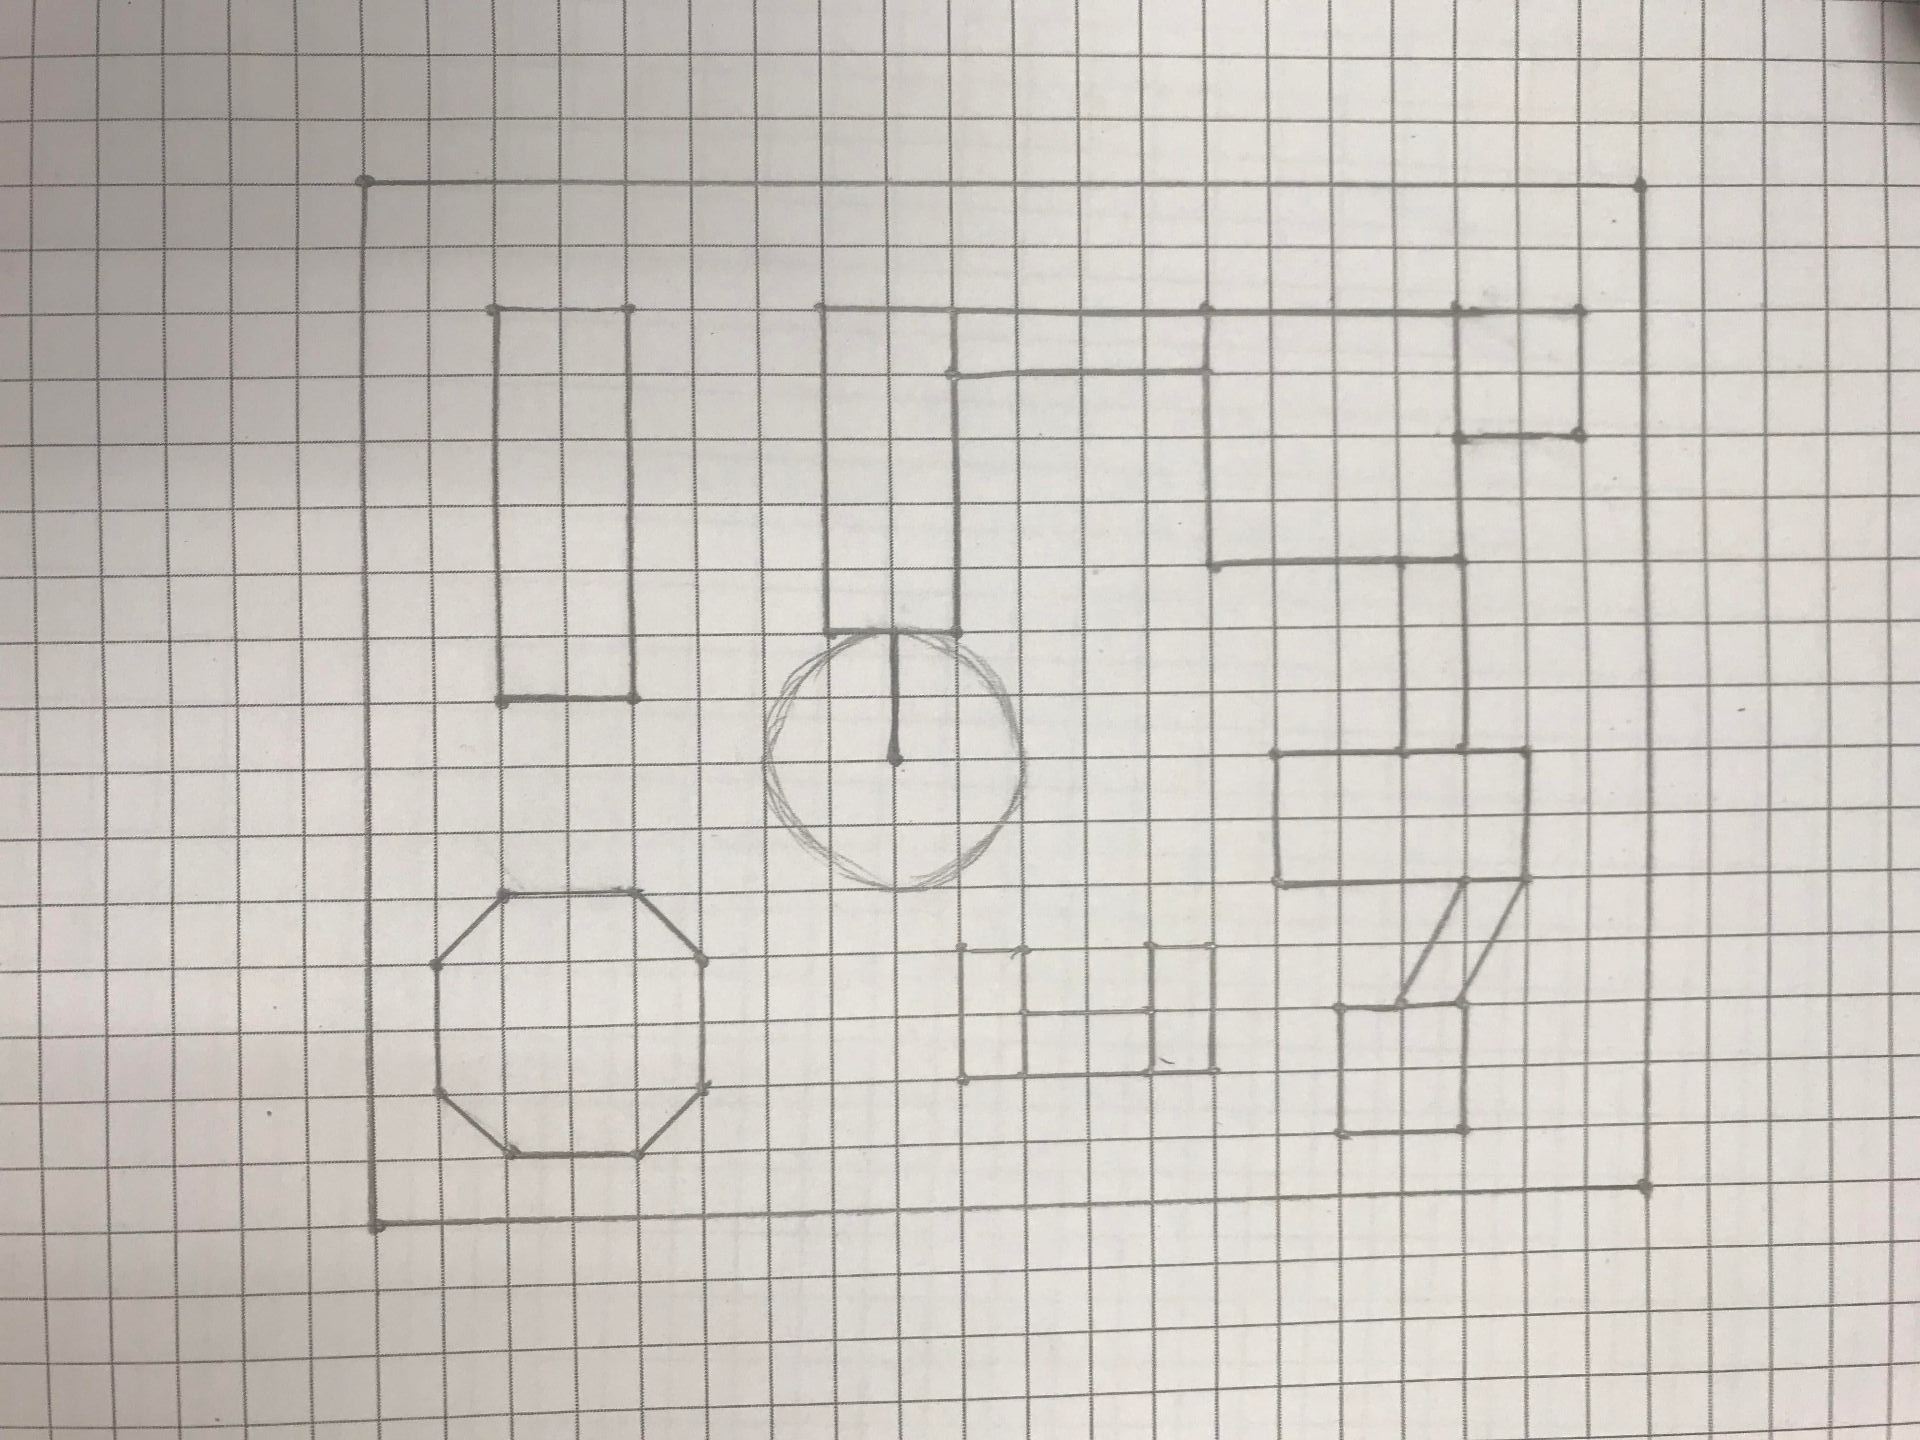
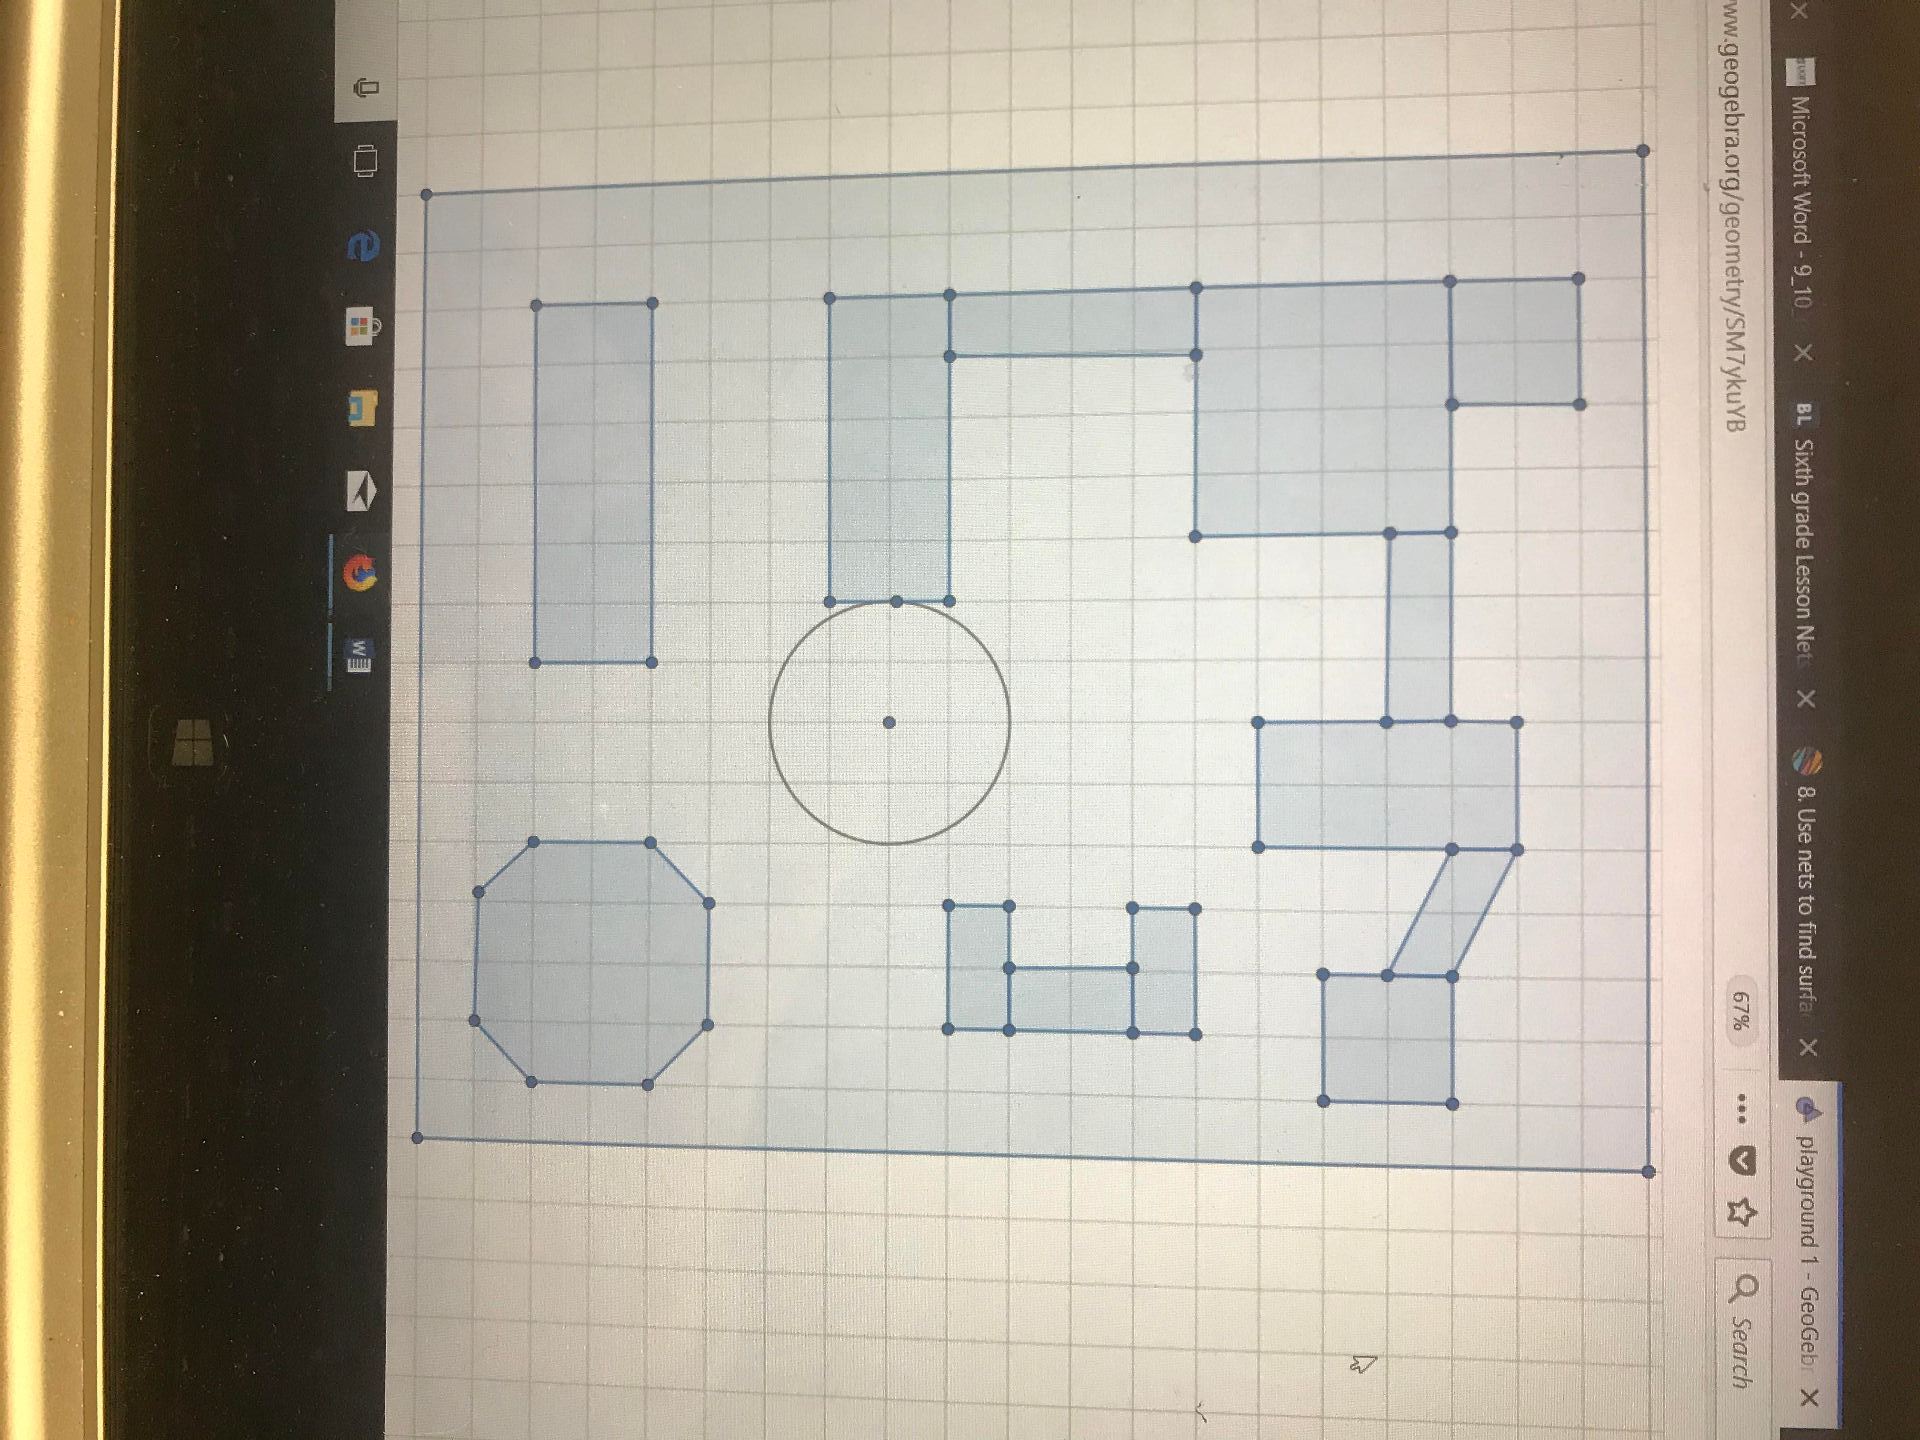
Below is a student’s sample playground

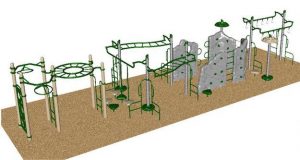
Rough Draft Blueprint                                Final Draft Blueprint                               Geogebra Blueprint
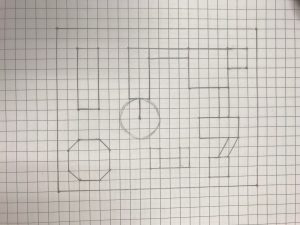
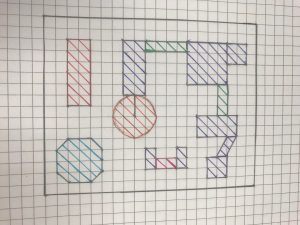
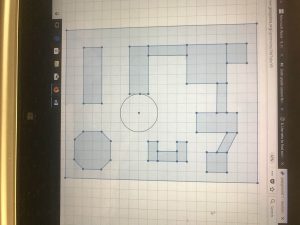
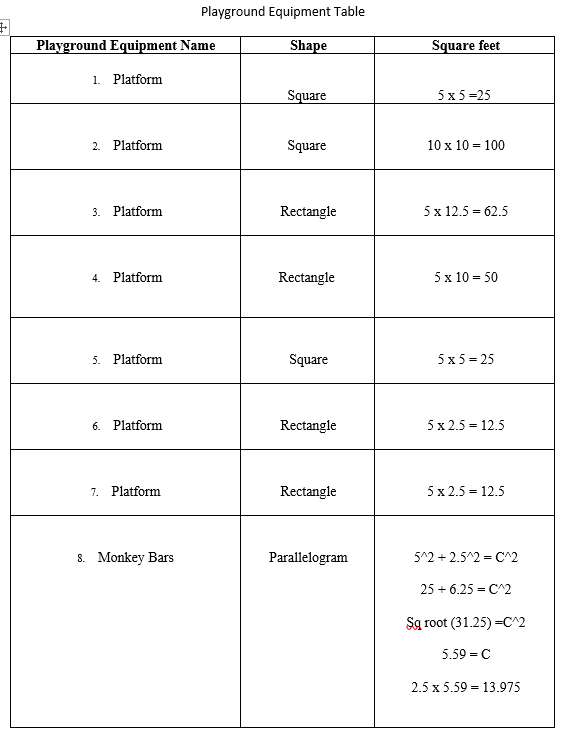
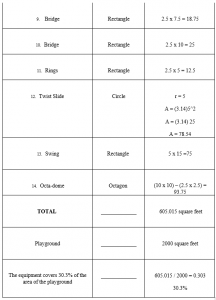
Table for Blueprint

Extension for “Build a Playground”:

As an extension to this lesson, students will later be able to work with 3 dimensional figures and nets to build the playground they have constructed in our lesson. This lesson emphasized finding and working with area of various geometrical figures and special reasoning. Using the knowledge, they have gained through our lesson, the students will be able to create the net that would best fit the equipment shape that they have presented to us on their “blue prints”.

In order to create the appropriate net, students will need to understand that the 3-dimensional shapes base will be the shape they have placed on their map in the lesson “Build a Playground”. This extension will cover CCSS.math.content.7.g.b.6 which states “Solve real-world and mathematical problems involving area, volume and surface area of two- and three-dimensional objects composed of triangles, quadrilaterals, polygons, cubes, and right prisms.” This extension will help students make connections to the relationships between 2-dimensional figures and 3-dimensional figures, and connect the concepts of surface area and volume to real-world scenarios.

Disneyland Drive! – 8.F.B.4, 8.F.B.5

Students are put to the test in this fun and highly interpretive summative review of the previous unit: linear functions!

You and your family are going on a trip to Disneyland, but you must drive there! Your parents have decided that they don’t want the wear-and-tear of such a trip on their own vehicle, so they have narrowed it down to two (2) rental vehicles. However, they are having a hard time figuring out which one would be the most efficient/economical choice. Your job is to gather all the information you can, and construct a minimum of five (5) equations, graph them on GeoGebra, and lastly must decide which car your parents should choose for your vacation!

In order to complete this lesson, students will be split into groups of 3-5 members. The class as a whole will have a set gas price, but each group will have different vehicles as well as a monetary cap that they must remain under.

ModelingLessonPlan

Rocket Math: 8.F.A.3, 8.F.B.5, MP4


Rocket Math

By: Natasha Smith, Mariana Rosas, Paloma Vergara, & Melisa Sanchez-Leyva


This modeling lesson is for an 8th-grade classroom and is focused on the standards CCSS.MATH.CONTENT.8.F.A.3 and CCSS.MATH.CONTENT.8.F.B.5. This lesson introduces students to the concept of nonlinear functions. In the lesson, students will be able to explore the concept of a nonlinear function and expand their knowledge of what a function can look like.

This lesson follows a similar format to Dan Meyers’ 3 Acts. Students will start by watching a video of a model rocket launch. Individually, they will quickly draw a graph of what they think the relationship between the height of the rocket and time is. Next, they will work in groups to plot the points estimating the relationship of the height of the rocket at each second. Lastly, the teacher will take them outside and launch a model rocket to prove or disprove students’ theories. The model rocket will have a Pocketlab attached to it which will provide an exact graph of the height of the rocket at each time point. Students will compare their graphs to the Pocketlab graph. We decided to launch the rocket again instead of providing students with a graph from the original launch in the final act as it adds an element of excitement to the activity and the students will enjoy going outside to watch the rocket launch.

This lesson incorporates multiple types of technology. For the video used in the lesson, teachers would achieve best results by filming their own rocket launch as they will want to use the exact same type of model rocket in both the video and the in-class launch. The video representation should be similar to this video. Students will also be using the website Desmos to graph points. Lastly, the teacher will be using a Pocketlab. The Pocketlab is a wireless sensor that can be attached to different objects and will record different types of data and output graphs. For this lesson, the Pocketlab can be attached to the model rocket and will record the height (altitude) of the rocket as time passes.

Lesson Plan and Worksheet.

SaveSave

SaveSave

SaveSave

SaveSave

SaveSave

SaveSave

SaveSave

SaveSave

SaveSave

SaveSave

Fence Fractions – 4.NF.B.3


Students are engaged in real world application of mathematical modeling when creating a fence using fractions that have unlike common denominators to add to make a whole. Tommy is building a fence and has one side length finished (1 whole) and needs help finding the other sides to his fence. The students will be given different fractions to analyze on geogebra–an online tool for students to use to help conceptualize fractions with unlike denominators. This lesson is designed for a 4th grade class modeling addition of fractions.  Students will be working individually to help Tommy create his fence.

Fence Lesson Plan-25objui

http://www.geogebra.org/m/ZrHpgCQv

Where Do We Meet? REI

screen-shot-2016-12-02-at-12-47-21-pm

WHERE DO WE MEET?

Where do we meet is an interactive activity that uses technology and mathematical concepts to create and solve real life scenarios. One of the Vernier products to compliment this lesson is the Motion Detector. This device allows for data to be collected through a calculator (or a computer software) where students can then analyze their findings. For this activity students will be able to see a real life scenario of the usage of the mathematical concept of Solving Systems of Liner Equations using a motion detector, calculator and themselves. In this activity, students will be able to part of the creation of data that will be used to create equations. Students will then take part in solving the system of equations using technology and on writing (mathematically). Students will be able to use this activity that ties to the following Common Core State Standards:

INQB.2 Collect, analyze and display data using calculators, computers, or other technical devices when available

APPD.2 Use computers, probes, and software when available to collect, display, and analyze data.

M3.2.H Formulate a question that can be answered by analyzing data, identify relevant data sources, create an appropriate data display, select appropriate statistical techniques to answer the question, report results, and draw and defend conclusions.

H.A.REI.1– Explain each step in solving a simple equation as following from the equality of numbers asserted at the previous step, starting from the assumption that the original equation has a solution. Construct a viable argument to justify a solution method.

H.A.REI.2– Solve simple rational and radical equations in one variable, and give examples showing how extraneous solutions may arise.

H.A.REI.5– Prove that, given a system of two equations in two variables, replacing one equation by the sum of that equation and a multiple of the other produces a system with the same solutions.

H.A.REI.6– Solve systems of linear equations exactly and approximately (e.g., with graphs), focusing on pairs of linear equations in two variables.

vernieractivity-wheredowemeet

Fashion Drawing vs. Real Humans CCSS.MATH.8.F.B.4 & 5, MP4

Blog Image

This is an 8th grade modeling lesson aligned with linear function models and graphs. Are the fashion artist’s proportions right? This activity challenges students to analyze body proportions generated by a fashion illustrator, then compare them to the student’s own specific body proportions. Students will collect data into a table, plot it onto a graph, and generate an equation to determine the accuracy of the fashion illustration’s proportions.


Fashion Proportion vs Human Proportion