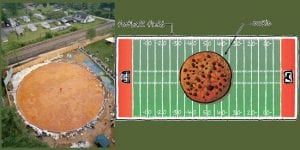
Cookie Monster or Monster Cookie? 7.G.B.6, MP1, MP2


Cookie monster? More like monster of a cookie…

The world’s largest cookie was baked by Immaculate Baking Company in Flat Rock, North Carolina in 2003. The area of the top of this cookie was 8,120 square feet with a diameter of 101 feet and weighed 40,000 pounds. Assuming that the cookie is a perfect cylinder, and its height was 6 inches, what is its volume? Round to the nearest cubic foot.

If there was an oven that could fit this cookie inside, what is the smallest volume size that the oven could be? (Hint: the oven must be a cube).

In this lesson, students will be using their knowledge of area and volume as well as mathematical reasoning to solve a problem that involving circles, cylinders, and cubes. The picture and the problem will intrigue students because they won’t believe that a real cookie was this big until they see it for themselves. Plus, who doesn’t love cookies? The teacher could also gain incentive and interest from the students by bringing in or having the students bring in cookies after the lesson.


CCSS.MATH.CONTENT.7.G.B.6

Solve real-world and mathematical problems involving area, volume, and surface area of two- and three-dimensional objects composed of triangles, quadrilaterals, polygons, cubes, and right prisms.

CCSS.MATH.PRACTICE.MP1

Make sense of problems and persevere in solving them.

CCSS.MATH.PRACTICE.MP2

Reason abstractly and quantitatively.

Gold Medal Problem 6.RP.A.3.C, MP3, MP6

Gold Medal Problem

By: Natasha Smith

BRONZE, SILVER, and GOLD… what place will you get?

As you can tell from the above picture, the U.S. takes home the gold when it comes to the Olympics. But have you ever wondered why they are able to take home so many medals?

In this lesson, students will discuss what effects how many medals a country receives at the Olympics. They will use data for the 2016 Olympics and calculate the percentage of medals each country received. Students will then compare and discuss the relationship between the percentage of medals each country received and its population and national wealth.

This lesson integrates Social Studies as students are looking at countries from all over the world and discussing how their different circumstances may affect their ability to receive Olympic medals. This lesson is culturally responsive as students will be critically thinking about how different countries may have advantages to winning Olympic medals and students may begin to realize that where you are from has a huge impact on your ability to medal. This lesson will also peak students interest as many of them follow the Olympics and idolize the athletes.

Extention: After comparing the data as a class, students will try and determine other factors that may have an impact on a country’s medal count. They will research and find their own data and decide whether or not they think the factor contributes to the amount of Olympic medals a country receives.

Math Standards:

CCSS.MATH.CONTENT.6.RP.A.3.C

CCSS.MATH.PRACTICE.MP3

CCSS.MATH.PRACTICE.MP6

Possible Social Studies Standard:

G.L.E.5.4.1: Analyzes multiple factors, compares two groups, generalizes, and connects past to present to formulate a thesis in a paper or presentation.

SaveSave

SaveSave

SaveSaveSaveSave

SaveSave

SaveSave

SaveSave

SaveSave

Apartment Proportions 7.G.A.1

Apartment Proportions

Problem:

Congratulations! You just got your first apartment. It’s located right in the heart of downtown Ellensburg. You just realized you do not have anything to put in your new living room which is 14’ by 12.5’.

Sadly, the store you want to get your furniture from only has a few options but they come in multiple proportions. Make sure you have at least one item from each of the categories. If an item is too large or small, use ratios to change the proportions. You are only allowed to have ten of the following items in your living room!

Hint: Do some of the sizes seem odd? You should probably use ratios to change the size.

Show your work!

Below are the furniture you can select from with the measurements.

Seating                                                            Misc

Couch 8’x4’                                                    Lamp 4’x4’

Chair 2’x3’                                                     Fan 4’x2’

Bean bag square 3’x3’                                  Bookshelf 3’x2’


Table                                                              Entertainment

Coffee Table 16’x9’                                       TV with stand 12’x10

Side Table .5’x.5’                                           TV 10’x2’

                                                                           Gaming Consoles 4’x6’

Rug

Fuzzy Rug 15’x8’

Rug 14’x6’


This picture was found at Clipart-Library. This lesson will focus on the CCSS.Math.Content.7.G.A.1 which is solve problems involving scale drawings of geometric figures, including computing actual lengths and areas from a scale drawing and reproducing a scale drawing at a different scale.

I would teach this culturally by understanding that all students come from different cultures and different cultures have different housing expectations.

Other standard:

CCSS.ELA-Literacy.W.7.4
Produce clear and coherent writing in which the development, organization, and style are appropriate to task, purpose, and audience.

World Population [Picture Problem] 8.F.B.5, L.8.3, and MP.1

By: Kimberly Younger

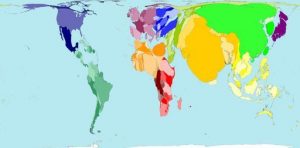
This image of the world, from World Mapper is skewed based off the current population in each country. Students will be assigned a country and will be asked to find out the population of the country in 1918 and the current population (2018) then they will compare the the change in population.

The lesson will focus on the standard CCSS.Math.Content.8.F.B.5 which is finding the functional relationship between two quantities, whether they are increasing or decreasing and for the this lesson they would be focusing on only linear functions. The lesson will be called Population Change Project, students will sketch the graph with the population data they collect and write a paragraph about the data the collect and interpret what it means. Including information about why they think the population increased or decreased.

This Lesson is culturally responsive because students will be learning about other countries and why the population may have increased or decreased over decade (1918 – 2018). Students could be supplied with websites which show the current population and the passed population or they can be given time to do the research on their own.

The students will use the mathematical practice of CCSS.Math.Practice.MP1 which focuses on students problem solve and preserve in solving math problems. CCSS.ELA-Literacy.L.8.3 is the use knowledge of language and its conventions when writing. The evidence of this standard would be found when students complete their write up about the change in population over the passed decade.

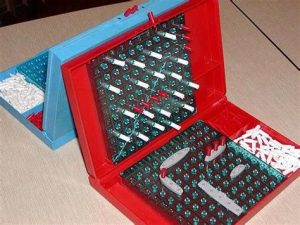
Battleship 5.G.A.1

Incorporating games into any lesson will make the learning process more engaging and hands-on. This will also be a fun activity for the students to do! The game Battleship is a great way to introduce and practice graphing points on a coordinate plane.

For this activity, students will have to understand the location of points on a coordinate plane in relation to the origin (0, 0). To understand this students will be playing on a modified version of the game board for Battleship to include all four quadrants. The game board could also be modified where the students only place their battleships in the first quadrant so it better represents real world problems. I would have developed these game boards prior to the lesson, which will be a laminated sheet of paper. Students will be placed into pairs and on their game board they will place their five battleships anywhere on the graph. Then they take turns calling out coordinate points to try and sink their opponents five battleships. For each miss they will mark those boxes on the graphs with an open circle to indicate that the shot was missed on that point. However, for each hit they will x that portion out and the opponent then receives another turn.

After the activity has completed, there will be a class discussion about how Battleship relates to graphing points on a coordinate plane. Additionally, the activity will acknowledge how the first number in the pair describes the location of the point from the origin on the x-axis and similarly for the y-axis.

Battleship can be integrated with history, geography, and science. For history, it can be related to when battleships were first invented and marketed, in 1943. Then connect the introduction of battleships to World War II and how it effected the war. Whereas for geography, the coordinate plane that is used to play the game on is similar to latitude and longitude lines on a map. This will lead to classroom discourse of how the crew needs to have a vast knowledge of the world map and where the latitude and longitude lines are in relation to other battleships. Additionally, this activity can be integrated within science by looking into buoyancy of the materials used in creating these massive ships. This game also could be used with the Periodic Table as the playing field for Battleship.

To teach culturally, as a class we can examine battleships for different countries. Then discuss the similarities and differences between them all. While looking at how the countries cultural influence plays a role in how their battleships appear and function.

CCSS.MATH.CONTENT.5.G.A.1: Use a pair of perpendicular number lines, called axes, to define a coordinate system, with the intersection of the lines (the origin) arranged to coincide with the 0 on each line and a given point in the plane located by using an ordered pair of numbers, called its coordinates. Understand that the first number indicates how far to travel from the origin in the direction of one axis, and the second number indicates how far to travel in the direction of the second axis, with the convention that the names of the two axes and the coordinates correspond (e.g., x-axis and x-coordinate, y-axis and y-coordinate).

CCSS.MATH.CONTENT.5.G.A.2: Represent real world and mathematical problems by graphing points in the first quadrant of the coordinate plane, and interpret coordinate values of points in the context of the situation.

CCSS.MATH.Practice.MP6: Attend to precision by understanding the location of coordinate points in relation to the origin when taking hits at their opponents battleship.

CCSS.MATH.Practice.MP7: Look for and make use of structure by recognizing the pattern of coordinate points in each quadrant. For instance, that a coordinate pair in the first quadrant will result in (positive, positive), in the second quadrant (negative, positive), third quadrant will be (negative, negative), and the fourth quadrant is (positive, negative).  
 

School Presidential Election 7.SP.A

School Presidential Elections

The students are learning about probabilities in math so they will apply these concepts to a real life event that happens every year in schools across our nation.This sample picture has so much meaning to all the students in the entire 7th grade class as it is about school culture. There is a number of probability activities this simple picture can expand to using mathematical practices as to who will win the election. Activities like: Will it be a girl or boy? Will it be the popular student or the student that delivers the best speech? Based on a mini session of class voting, will it be an accurate representation of the actual event?  For this particular activity there is a total of 6 students in the running for class president, 2 boys and 4 girls. The students will use red poker chips for the girls and blue poker chips for the boys as well as a randomization holder (paper bag). This process will help determine whether a girl or boy will be president based on some fun probability activities (SEE HANDOUT ATTACHMENT). The students will also explain as to what parts of the activity are empirical or theoretical and why as well as learn the Law of Large Numbers. This activity aligns with CCSS.MATH.CONTENT.7.SP.A.1 & 2

PictureProblemActivity

Planning a Party HSA.CED.A.2

cupcakes


You have a big birthday party coming up soon. You invited 16 people for the occasion.  The problem is, you haven’t gotten cupcakes yet. While considering the number of cupcakes to buy, your rule is each person attending (including yourself) must have 2 cupcakes each. Assuming that each person you invite will come and have their 2 cupcakes, how many cupcakes should you buy to hold true to your rule (2 cupcakes for everyone)?

This problem can be manipulated in many ways. For instance, what if you wanted each person to have 3 cupcakes? 5? We can let the number of cupcakes you are buying to be y and the number of cupcakes per  person be x and create an equation for the number of cupcakes you should buy for your party (n) and the number of cupcakes per person (x).

Now you are having second thoughts. Instead of yourself having the same number of cupcakes as everyone else, you want to have one more (so you would have x+1 cupcakes and everyone else would have x). How would this change your equation above? Create a new equation demonstrating this new rule with the same variables.

Now that you have established how to manipulate the equation based on changing information, you want to create an equation for future parties that you host showing the amount of cupcakes (or other food items) you need to have based on: the number of food item you want for each person, the number of people that will be there, and the amount (if any) more you want to have for yourself. Let these variables be x, y, and z respectively and the number of food items you need be the variable n. Create a brand new equation given these variables for the number of food items you need.

At times, it can be very difficult to engage math students in a classroom. Story problems are somewhat recommended because they can bring relevance from the students’ lives into a math problem. What preceded is an extended story problem involving something that all students will love: food. Along with the problem, the picture should make students’ mouths water. This problem should be relevant to almost all students and possibly give them some party planning advice.

The Common Core State Standard this problem is aligned with is HSA.CED.A.2:
Create equations in two or more variables to represent relationships between quantities.

GMD.B.4-Play Time with Play-Doh

play-doh

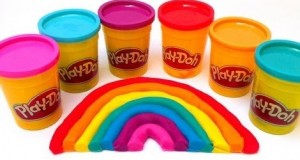
There is something very therapeutic about playing with play-dough. All children of all ages whether they admit it or not enjoy playing with play-dough and what better than to incorporate it into learning math. Using playdough in a subject that stresses many students can be very beneficial and making visualizing math concepts making the problems easier to approach.

For example, given the high school geometry standard:

CCSS.MATH.CONTENT.HSG.GMD.A.3
Use volume formulas for cylinders, pyramids, cones, and spheres to solve problems.*
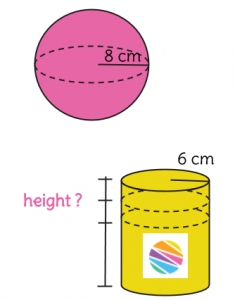
We can work on solving problems like:                           play-dough-diagram
Given that the radius of a sphere of play-dough is 8 cm.
If the cylinder it needs to fit into is only 6 cm, what is the minimum height the cylinder must be in order to fit all the play-dough inside of it?


Allowing students first to try the problem hands on will work on engaging the students and with the visualization solving the problems will become less of a stressful situation. And from this, we can create other similar problems in which the shapes the problem works with changes. Such as what could change if we had a pyramid shape of play-dough that needed to fit into a cone shape container.