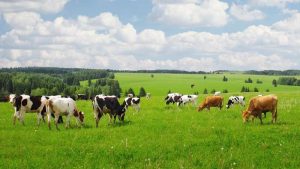
This picture – taken from Freedom Works UK – becomes the center of a fun and highly interactive mathematics lesson where students get to think what it might be like to be a farmer! Students will be assigned a set number of cows that eat a set square footage of grass per day, and must determine how much land is needed in order to sustain the cows. Furthermore, students must consider the amount of time needed in order for grass to grow back, but they must have enough already grown for the cattle to eat in the meantime.
This lesson has students focus working on the Common Core State Standards:
CCSS.MATH.CONTENT.8.F.B.4
Construct a function to model a linear relationship between two quantities. Determine the rate of change and initial value of the function from a description of a relationship or from two (x, y) values, including reading these from a table or from a graph. Interpret the rate of change and initial value of a linear function in terms of the situation it models, and in terms of its graph or a table of values.
CCSS.MATH.CONTENT.8.F.B.5
Describe qualitatively the functional relationship between two quantities by analyzing a graph (e.g., where the function is increasing or decreasing, linear or nonlinear). Sketch a graph that exhibits the qualitative features of a function that has been described verbally.
CCSS.MATH.PRACTICE.MP2
Reason abstractly and quantitatively.
Mathematically proficient students make sense of quantities and their relationships in problem situations. They bring two complementary abilities to bear on problems involving quantitative relationships: the ability to decontextualize—to abstract a given situation and represent it symbolically and manipulate the representing symbols as if they have a life of their own, without necessarily attending to their referents—and the ability to contextualize, to pause as needed during the manipulation process in order to probe into the referents for the symbols involved. Quantitative reasoning entails habits of creating a coherent representation of the problem at hand; considering the units involved; attending to the meaning of quantities, not just how to compute them; and knowing and flexibly using different properties of operations and objects.
This lesson correlates to the culture of the Ellensburg area, for a large portion of this area is populated by those in the agricultural profession. While most of them are in the hay production/distribution realm, students could connect to this rural lesson nonetheless.

Hi Kylie,
This is a great rich math task. You could use this same concept and corresponding CCSS.MATH.CONTENT.8.F.B.4 with a different activity as an extension to this one. To help students review and conceptually understand what a linear function represents, you could have students match graphs to corresponding expressions. This extension also serves as a tool to get students up out of their seats, moving and engaging in discussions. You could create digital graphs and print them out to make cards. Then, you could type up the corresponding linear function for each of the graphs in slope intercept form, y=mx+b. You could then give each student either a graph or a function and then have them move about the room to match their graph to someone else’s expression and vice versa. This would not only elicit student voice by having students discuss characteristics of linear functions, but also encourages students to work collaboratively. An extension of this activity that could be used for advanced students is to give them both slope intercept form and point slope form expressions and have them match both to a corresponding graph.
Thanks for posting a great idea!