Extended Mathematical Practice: Learning About Numerics, Base Systems, and Modular Arithmetic Outside of the Curriculum – MP 1,3,7,& 8

Learning Progression for edTPA – Extended Mathematics

Standards:

  • CCSS.MP-1 – Make sense of problems and persevere in solving them.
  • CCSS.MP-3 – Construct viable arguments and critique the reasoning of others.
  • CCSS.MP7 – Look for and make use of structure.
  • CCSS.MP-8 – Look for and express regularity in repeated reasoning.

Task Summary: Students will be given an inquiry prompt to answer as students work through activity sheets that will have students finding values of numbers in ancient systems (e.g. Egyptian, Babylonian, Mayan), different bases, and in modular expressions. Students will also find solutions for addition and subtraction problems in different bases and with modular arithmetic. Students will also discuss their ideas, findings, and questions using mathematical thinking and reasoning. These tasks are designed to develop students’ mathematical thinking and reasoning.

Assessment Task Summary: Students will be assessed on their mathematical thinking and reasoning by their written work or mathematical discourse. Scoring of the assessment will be done via a rubric based on the standards above and learning targets for each task.

Where Do We Meet? REI

screen-shot-2016-12-02-at-12-47-21-pm

WHERE DO WE MEET?

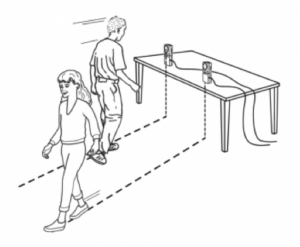
Where do we meet is an interactive activity that uses technology and mathematical concepts to create and solve real life scenarios. One of the Vernier products to compliment this lesson is the Motion Detector. This device allows for data to be collected through a calculator (or a computer software) where students can then analyze their findings. For this activity students will be able to see a real life scenario of the usage of the mathematical concept of Solving Systems of Liner Equations using a motion detector, calculator and themselves. In this activity, students will be able to part of the creation of data that will be used to create equations. Students will then take part in solving the system of equations using technology and on writing (mathematically). Students will be able to use this activity that ties to the following Common Core State Standards:

INQB.2 Collect, analyze and display data using calculators, computers, or other technical devices when available

APPD.2 Use computers, probes, and software when available to collect, display, and analyze data.

M3.2.H Formulate a question that can be answered by analyzing data, identify relevant data sources, create an appropriate data display, select appropriate statistical techniques to answer the question, report results, and draw and defend conclusions.

H.A.REI.1– Explain each step in solving a simple equation as following from the equality of numbers asserted at the previous step, starting from the assumption that the original equation has a solution. Construct a viable argument to justify a solution method.

H.A.REI.2– Solve simple rational and radical equations in one variable, and give examples showing how extraneous solutions may arise.

H.A.REI.5– Prove that, given a system of two equations in two variables, replacing one equation by the sum of that equation and a multiple of the other produces a system with the same solutions.

H.A.REI.6– Solve systems of linear equations exactly and approximately (e.g., with graphs), focusing on pairs of linear equations in two variables.

vernieractivity-wheredowemeet

What does common sovereignty mean? (MP3 Math Reasoning)

Integrated Mathematics and Social Studies Lesson
th-2
The United State Constitution protects tribal sovereignty by Indian Nations but the Indian Nations are not completely sovereign. To understand the interplay between Tribal, Federal, State, and local governments on the Tribal sovereignty read the attached HS_US_L2_Supremacy_Commerce_Clauses_Boldt.

Fishing rights were among the rights protected by treaties for many of the tribes in Northwestern Washington. In 1974 the Boldt decision reaffirmed the “usual and custom” fishing grounds and rights of the treaty tribal (native) people of coastal Washington State.  The Boldt decision was the result of much conflict for many years leading up to the 1970’s, to understand this conflict read the attached HS_US_L1_Constitution_Boldt_Article_Activity.

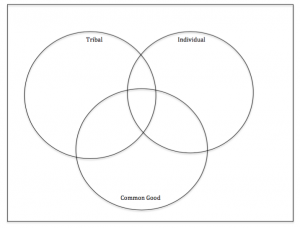
In the Boldt decision, Judge Boldt considered the interaction between individual rights, tribal rights, and the common good [non-tribal people]. A part of the decision was that treaty Indians were entitled to 50 percent of the fish that came to the “usual and accustomed places” because an 1854 treaty used the language “in common with.” The Boldt decision is attached Boldt_Decision.

The ramification of this decision is still very much apart of fishing today in Northwest Washington.  To understand some of the present views read the following  Seattle PI article and history lesson.  In present day legal decisions and ecological activities cooperation is needed to ensure that the number of salmon is increased.

As a math lesson uses your knowledge of Venn diagrams to identify the region of the Venn diagram you feel a current legal or ecological issue should reside. Each student needs to identify at least two issues from one of the three documents and one of personal interested. Write your issue on a posted note and place the note in the region on the Venn diagram you feel this issue should reside. After all students have place three posted notes on their Venn diagram the students will get into groups of four to discuss their claims. The teacher will take notes during the group discussion period and discuss the placement of one issue from each group.  Rubric for the lesson in on the attached worksheet. Venn Diagram Boldt Decision – Impact Issues between individual

Screen Shot 2015-12-11 at 12.41.19 PM


5-MD.1 The Slow Forty

The Slow Forty is a math problem found on Dan Meyer’s 3-Acts math task website. The link for this problem can be found from the first three words of the blog. The problem: How fast do you think Rich Eisen runs in miles per hour?

The Common Core State Standards for this problem are

CCSS.5-MD.1 

1. Convert among different-sized standard measurement units within a given measurement system (e.g., convert 5 cm to 0.05 m), and use these conversions in solving multi-step, real world problems.

CCSS.MP.4

Mathematically proficient students can apply the mathematics they know to solve problems arising in everyday life, society, and the workplace. In early grades, this might be as simple as writing an addition equation to describe a situation. In middle grades, a student might apply proportional reasoning to plan a school event or analyze a problem in the community. By high school, a student might use geometry to solve a design problem or use a function to describe how one quantity of interest depends on another. Mathematically proficient students who can apply what they know are comfortable making assumptions and approximations to simplify a complicated situation, realizing that these may need revision later. They are able to identify important quantities in a practical situation and map their relationships using such tools as diagrams, two-way tables, graphs, flowcharts and formulas. They can analyze those relationships mathematically to draw conclusions. They routinely interpret their mathematical results in the context of the situation and reflect on whether the results make sense, possibly improving the model if it has not served its purpose.

The first video is about 15 seconds long and in the video you see Rich start running at the 0 yard line (The Goal line) and you watch him run to the 40 yard long. In the video you are also given the amount of strides Rich takes. After the video students are asked to answer the following questions:

  • 1. How fast do you think Rich Eisen runs in miles per hour?
  • 2. Write a guess.
  • 3. Write a guess you know is too high.
  • 4. Write a guess you know is too low.

Students will the have either a group or classroom discussion about their answer and give reasons to support their answers. Students will then be asked to come up with a solution that they all agree on and a possible equation to support their work. After the students have agreed on a speed for Rich they will then watch an 8 second video with the correct answer of Rich’s speed. After watching the video students will then discuss the following questions:

  • 5. Is your answer different from Rich Eisen’s fastest speed? Is it lower or higher? What could account for the difference?
  • 6. The World Almanac of Books and Facts reports a cheetah running at 70 miles per hour. How many seconds would it take a cheetah running at that speed to finish the 40-yard dash?

This lesson is a great way to get engaged in the group and/or classroom discussion because it gives each student a chance to state their own opinion on the answer and support other students in problem solving. One thing I would suggest students do to determine an equation to get the correct answer would be to start with what they know, and go from there. Maybe even have one student from each group run a short distance, determine how many steps the student took to get there, and how long it took. From there the students can create an equations that matches their information, to determine their speed and continue with the information from the video from there.

I have learned that students work better in small groups and work better when they can share their ideas with the class, that way if two students have the same guess, they can support each other to give reasons why they chose that answer. This is a way to build respect and rapport between the students and with the teacher.

G-MG.1: Feeding Minds

The 3-Act Math Task, Meatballs by Dan Meyer, can be found at http://www.101qs.com/2352-meatballs.  This activity is ideal for those spaghetti lovers in your classroom. It involves learning how to calculate how many meatballs can be placed in a pot of spaghetti sauce with out causing the sauce to overflow. This can easily relate to the majority of your students, whether they cook the spaghetti and meatballs themselves or they just eat it. This activity allows students to be constantly engaged through a subject of interest, various discussion starter questions, and mini videos.

Act 1 of this task begins with a video of boiling spaghetti sauce that ends with a bowl of meatballs about to be entered into the sauce pot. This is followed with the following discussion starter questions:

1. How many meatballs will it take to overflow?

2. What is a number of meatballs you know is too high?

3. What is a number of meatballs you know is too low?

This allows students to be fully aware of their central focus for the day and begin to brainstorm of the answer possibilities.

In act two students are asked what information would be useful to know here? As students begin to answer this question, the teacher will show the students images of the things that would be useful to know to answer the leading question (How many meatballs will it take to overflow?). The images consist of the height remaining in the pot, the diameter of some sample meatballs, the diameter of the pot, and the number of meatballs. During this act the teacher will also either teach or review volume formulas of cylinders and spheres so that they can proceed to the next act. Through this act students begin to think of ways in which they can approach this problem and what information is needed to begin to solve for the solution.
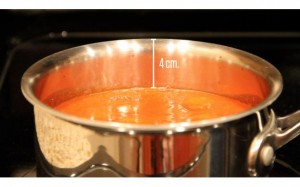
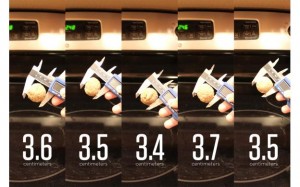
_1303_emptyheight_1304_meatballdiameter_1305_t_1306_t


During act three students will use the information collected during act two to calculate the space left in the pot and the volume of the meatballs and predict a number of meatballs that will fill the remaining space or cause the pot to overflow. Once students have made their calculations/predictions, the teacher will show a video of meatballs being placed in the pot one by one until the pot slightly over flows, providing students with the answer to check how close their predictions were.

This task is aligned to CCSS.Math.Content.HSG-MG.A.1: Use geometric shapes, their measures, and their properties to describe objects.  This task allows students to compare one shape (cylinder/room remaining in pot) to another (sphere/meatballs), as they are trying to determine how many meatballs fit in the remaining room in the pot. In order to do so students must be taught the volume formulas of these geometric shapes and be able to determine how one shape would fit into the other.

Meatballs is also aligned to CCSS.MATH.PRACTICE.MP4: Model with mathematics. Mathematically proficient students can apply the mathematics they know to solve problems arising in everyday life, society, and the workplace. For this task students used their knowledge of cylinders and spheres to determine how many meatballs they can put in their spaghetti sauce before it overflows. This can be applied by all students in their every day lives and shows students how math is a part of our daily lives and doesn’t only arise in school settings.
6.RP.3 Shower v. Bath

Shower v. Bath

The 3-acts math task, “Shower v. Bath,” by Dan Meyer can be found at http://mrmeyer.com/threeacts/showervbath/.

This activity is aligned to:

  • CCSS-Math 6.RP.3: Use ratio and rate reasoning to solve real-world and mathematical problems, e.g., by reasoning about tables of equivalent ratios, tape diagrams, double number line diagrams, or equations.

The first act is a split screen video of a guy sitting in the bath on the bottom part of the screen and him standing in the shower in the top part of the screen.  Underneath the video, there is a question: “which do you think is cheaper: a shower or bath? Why?” The second act has a video of the duration of the shower and bath. The guy takes a shower in about 2 minutes and 24 seconds and takes a bath in about 8 minutes and 10 seconds.  There is also a video of the water rate in minutes per gallon for the bath and the shower.  It takes the faucet for the bath only about 11 seconds to fill up a one-gallon jug and it takes the shower head about 27 seconds.  Then under the videos there is an image of the cost of water in Mountain View, CA.  The third act has four questions: “how would the situation have to change for the answer to reverse itself,” “how long of a shower can he have with the same amount of water he used for the bath,” “which is cheaper for you? Collect data on your own shower and bath usage,” and “which is cheaper for your class? Average the data from all your classmates.”

For the lesson, I would introduce the activity by showing my students the first act video and ask them which they think would be cheaper. A good way for the students to actively participating in the activity is to give each of the students white boards. This way they can write either bath or shower and hold up their prediction and I can choose a few students to explain why they chose their prediction.  This will get the students thinking what option would use more water and what factors go into figuring out this problem. I will have the students brainstorm what information they are going to need in order to be able to get an answer in the end. From here I will show the video of how long it takes for the man in the video to shower and bathe and how long each option takes to fill up a gallon jug. This will be a good problem for the students to really think and work through the problem.

I will formally assess the students by having each student create a small poster with comparing their data to their classmate’s data. This will have the students making graphs, charts, finding averages, and making comparisons. From the poster, it will be clear if they met the learning target.

G-GMD 3-Acts Math Task: Water Tank

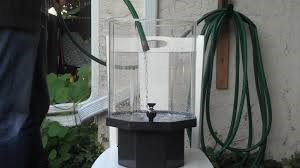
The Water Tank math problem was found on the Dan Meyer’s 3-Act Math task website. This problem has students figure out of fast it takes to fill up the water tank. This activity can be found at the following link:

http://mrmeyer.com/threeacts/watertank/

watertank

Students will first watch a 17 second video of a water tank being filled. After the students watch the video, they will make guesses, one that is too high and one that is too low, on how long they think it will take to fill up the tank. After making their guesses, students will then discuss what information is needed to solve this problem. Students will then work on the information discussed to see if they can determine how long the water tank takes to fill. After the students determine an answer from their information, another 12 second video will be displayed and students will determine if their answer was right or wrong. An additional exercise is determining how fast it takes the tank to empty.

The Common Core State Standards that are addressed in this problem are from High School Geometry: Geometric Measurement and Dimension:

G-GMD.3 Use volume formulas for cylinders, pyramids, cones, and spheres to solve problems.

G-GMD.4 Identify the shapes of two-dimensional cross-sections of three-dimensional objects, and identify three-dimensional objects generated by rotations of two-dimensional objects.

Students will reach these standards through the videos and through the investigation of information. I will begin the activity by showing the first video. Then I will ask my students what information is needed in order to solve the problem and what formulas are needed to find the answer to the problem. The students will meet the first standard by determining a volume equation that will give us the correct answer. The students will meet the second standard by determining what two-dimensional shapes make up the three-dimensional shape. This could help us create a volume formula that we could use to find the answer. Students will also need help converting from volume into desired units. After the volume is determined, students will then convert the volume into ounces, watch a video on how long it takes to fill 16 ounces, and then finally determine how much time it takes to fill the water tank. Students will be formatively assessed through classroom discussions, group discussions, and the use of a worksheet.

This lesson is a great way to get students engaged and enjoy the activity because the lesson is interactive and has videos. Students would work in small groups and as a class to determine the answer the question. I have found that students work better in small groups and work better when they can share their ideas with the class. This is a way to build respect and rapport between the students and with the teacher. Also, the teacher can better monitor the students learning progress and manage the classroom. Technology is integrated into the lesson when the students are viewing the videos and images from the website that was given above.

F.IF – What is my Heart Rate?

heart_rate_data

This is a great interactive activity that helps students determine their hear rate after doing certain physical activities. Students can determine which activity will raise their hear rate the most and the least. This is important to real world problems because if you want to burn calories and lose weight, it would be very helpful to know which physical activities get your heart rate up the most. Also, students can determine how long it takes for their heart rate to go back to its normal rate. This is important because after doing a certain physical activity, it would be helpful to know how long it takes for your heart rate to go to its rest rate.

In this activity, students will be measuring and graphing their heart rates using graphing calculators and a hand held heart rate monitor. Students will perform 3 trials. Trial 1 will consist of rest, marching, and jogging in place. Trial 2 will consist of rest, jogging in place, and running in place. Trial 3 will consist of rest, marching in place, and jumping jacks. Each activity is 1 minute long. Students will create three graphs based on the three trials performed. The hand held heart monitor will be connected to the graphing calculator and graphing calculator will be collecting constant data for each trial. After each trial is completed, the graphing calculator will display the graph for the student. The student will sketch the three graphs on a worksheet: on the worksheet, the students will talk about the rates of change of each parts of the graph (constant, increasing, or decreasing). This activity lines up with the Common Core State Standards by meeting standard CCSS.Math.Content.HSF.IF.B.6. Students will be interpreting the rate of change of the function of their heart rate. They will be interpreting the rate of change symbolically.

The materials needed for this activity are as follows:

This activity will work better if students work in small groups. Students should be put int groups of 2 or 3. Each student in the group will be completing an experiment of their own. That way each student can be engaged and evaluate their own data.


F.IF – Walking Velocity

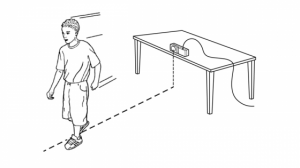
Technology is a great way to engage your students in math class. Using technology in the classroom will help the students stay engaged in their learning. But how do we integrate technology into the classroom? There are lots of ways to do this; one way is to use the products of Vernier. Vernier is a company that specializes in teaching math and science with technology http://www.vernier.com/. One of their products is a motion detector that connects to a graphing calculator. This product can be used in many ways but for this lesson it will be used for measuring velocity.

motion detector

When you do anything with motion you are probably interested in the distance traveled, time it took and the speed or the velocity of your motion. In this lesson students will learn about the four quantities and even more. Speed and velocity are often interchanged but are not the same thing. Speed tells you how fast you are going while velocity is the rate of change of position. Position is the distance from the starting point or origin and the rate of change is how fast something is moving to or from the origin. In this lesson students will explore velocity using the Vernier motion detector.

lab.RWV-01-DQ-walk_the_line.560.315


Students will set up the motion detector on a table with no objects in front of it. Students will stand one meter in front of the motion detector and walk slowly away for about two seconds at a uniform random rate. This will detect how fast you are moving and how far away you are form the motion detector. Then the student will walk toward the motion detector for the remaining of the time. All of this data will be collected by the motion detector for the students to analyze. The students will then answer analysis questions based on the data they collected. These questions are about velocity and how it changed as the students position and speed changed.

The common core state standard for this lesson is CCSS.MATH.CONTENT.HSF.IF.C.7Graph functions expressed symbolically and show key features of the graph, by hand in simple cases and using technology for more complicated cases. Students will graph and analyze their data found from the activity.

Worksheet for this activity: http://www.vernier.com/files/sample_labs/RWV-12-DQ-velocity_test.pdf

A-SSE Throwing a Ball

Title: A-SSE Throwing a Ball

Alignments to Content Standard: HAS-SSE.B.3.a Factor a quadratic expression to reveal the zeros of the function it defines.

Problem:

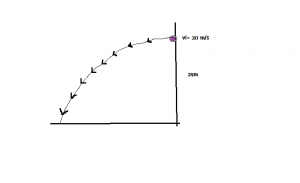
A big ball is thrown from a top of a 24m building with an initial velocity of 20 m/s and as the ball is falling, gravity acts on the ball pulling it downward towards the ground. The speed of the ball changes by a rate of 4m/s^2. What is the time in seconds that the ball hits the ground?

Commentary:

The purpose of this task is for students to first build a quadratic equation from the information given, factor the quadratic equation, and solve for the zeros to find the correct time of the ball hitting the ground.

Solution:

The height of the ball starts at 24m.

It travels at an initial velocity of 20 m/s.

Gravity pulls the ball downward towards the ground, changing the speed by 4m/s^2.

t is for time.


The quadratic equation is -4t^2 +20t +24mathill


This can be factored into (4t + 4) (-t +6) = 0

Set both binomials equal to 0 and solve for t.

4t +4 =0                -t +6 =0

4t = -4                     t = 6

t = -1

Because you cannot have a negative time, the ball hits the ground after 6 seconds.