WHERE DO WE MEET?
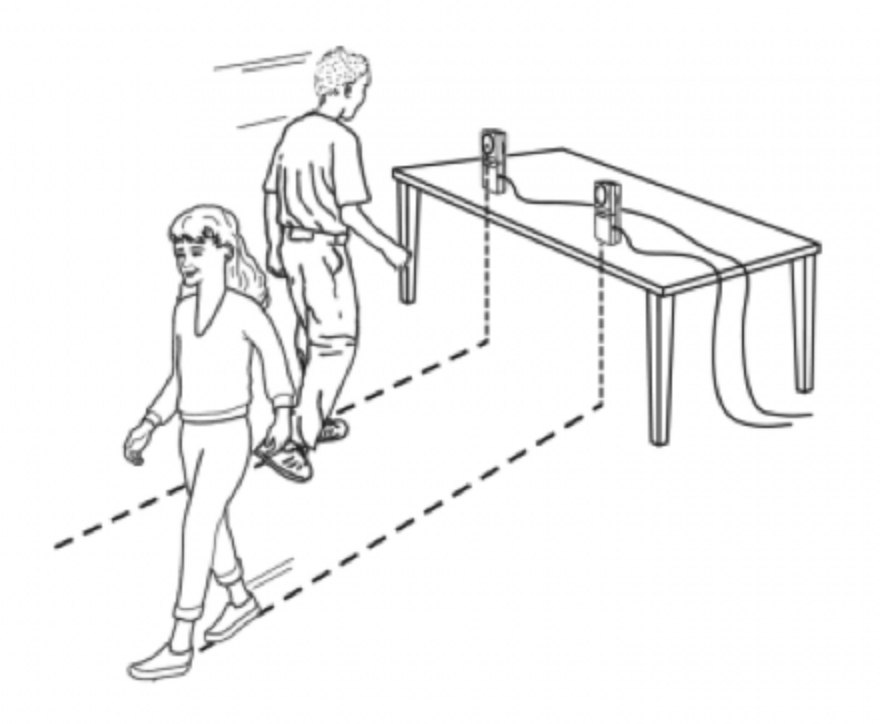
Where do we meet is an interactive activity that uses technology and mathematical concepts to create and solve real life scenarios. One of the Vernier products to compliment this lesson is the Motion Detector. This device allows for data to be collected through a calculator (or a computer software) where students can then analyze their findings. For this activity students will be able to see a real life scenario of the usage of the mathematical concept of Solving Systems of Liner Equations using a motion detector, calculator and themselves. In this activity, students will be able to part of the creation of data that will be used to create equations. Students will then take part in solving the system of equations using technology and on writing (mathematically). Students will be able to use this activity that ties to the following Common Core State Standards:
INQB.2 Collect, analyze and display data using calculators, computers, or other technical devices when available
APPD.2 Use computers, probes, and software when available to collect, display, and analyze data.
M3.2.H Formulate a question that can be answered by analyzing data, identify relevant data sources, create an appropriate data display, select appropriate statistical techniques to answer the question, report results, and draw and defend conclusions.
H.A.REI.1– Explain each step in solving a simple equation as following from the equality of numbers asserted at the previous step, starting from the assumption that the original equation has a solution. Construct a viable argument to justify a solution method.
H.A.REI.2– Solve simple rational and radical equations in one variable, and give examples showing how extraneous solutions may arise.
H.A.REI.5– Prove that, given a system of two equations in two variables, replacing one equation by the sum of that equation and a multiple of the other produces a system with the same solutions.
H.A.REI.6– Solve systems of linear equations exactly and approximately (e.g., with graphs), focusing on pairs of linear equations in two variables.

 numerous more lessons involving it, and is especially useful for any movement-based projects/lessons that a teacher plans to do.