Exponential Growth and Decay Models F.LE.A

Learning Progression edTPA
High School: Algebra with Trigonometry
EXPONENTIAL GROWTH AND DECAY
The class I will be teaching is an algebra class with
trigonometry. The textbook used will be Algebra 2:
Equations, Graphs, applications by Ron Larson, Laurie
Boswell, Timothy D. Kanold, and Lee Stiff, published 2004
by McDougal Littell. This learning progression will follow
the student through meeting the Common Core State
Standards about exponential growth and decay. These
Common Core State Standards will be covered in chapter
8 of the textbook, sections 1 and 2. These sections cover
exponential growth and decay models. That is, to be able
to create an equation, graph it, and solve problems with
exponential models. The standards for these lessons will
cover the cluster involving exponential functions,
including HSF.LE.A.1.C, HSF.LE.A.3, and HSF. LE.B.5. The
math practices that are going to be used throughout the
learning progression are as follows: MP2, MP3 and MP4.
These lessons will span three days. The exponential
growth model lessons will take the first two days and the
exponential decay model lesson will take the third day.
On the fourth day, the students will have a worksheet
with practice problems covering 8.1 and 8.2. This gives
the students a chance to show me how well they are
understanding the material because I will collect the
worksheet at the end of class and will use it to see how
the students are doing. I can assess what they
understand and what I need to cover again.

CCSS.Math.Content.HSF.LE.A.1.C:
which is about modeling exponential
functions and interpreting situations that
need to be solved with an exponential model.
CCSS.Math.Content.HSF.LE.A.3:
Observe using graphs and tables that a
quantity increasing exponentially eventually
exceeds a quantity increasing linearly,
quadratically, or (more generally) as a
polynomial function.
CCSS.Math.Content.HSF.LE.B.5
Interpret the parameters in a linear or
exponential function in terms of a context.
COMMON CORE STATE STANDARDS
MATHEMATICAL PRACTICES
CCSS.Math.Practice.MP2:
Reason abstractly and quantitatively
CCSS.Math.Practice.MP3:
Construct viable arguments and critique the
reasoning of others.
CCSS.Math.Practice.MP4:
Model with mathematics.

Lesson 8.1 Exponential Growth Day 1
This lesson is the first day of a two-day lesson on
exponential growth model. Day-one is an introductory
lesson to the concept. I will start the lesson off by asking the
students what they remember from the prior year about
exponential growth. The students would have been
introduced to the concept in their algebra 1 course with a
very basic overview of the concept. I will then give the
students the equation for exponential growth for them to
get in their notes. The equation is y=bx where b>1 to create
a growth equation. I will tell the students that if the b is less
than 1 this is a decay function which we will get to later in
the chapter. I will also define an asymptote as it relates to
the graph, that is a horizontal asymptote on the x-axis or
y=0. I will then give the students four example problems in
which we will go through graphing together. Once I will as
though the students understand how to graph exponential
growth, I will show them a more complex equation which
includes transformations. They will now have the equation
y=abx-h+k where a represents stretching and shrinking, h is
the shift left or right and k is the shift up and down. I will
then give the students one equation to graph on their own
using transformations.
After we have completed the notes for this section, I will
move to a class activity. I will post graph paper sticky notes
on the front board with exponential equations on the top of
each paper. The students will come to the front of the class
and pick a sticky note and graph it individually, which is
modeling or MP4. They will put their names on the back and
post them back on the board when they are finished. They
will then look over other answers that have been posted. If
the students have and questions or comments, they can
look at the name on the back and find the person to discuss
the answer. The students will then have to explain their
answer and their thinking which will create great
conversations about the concepts, thus using MP3 in this
activity.

Learning Targets:
I know about the exponential growth
model.
I can graph exponential growth
equations
Common Core State Standard:
CCSS.Math.Content.HSF.LE.A.1.C:
which is about modeling exponential
functions and interpreting situations
that need to be solved with an
exponential model.
CCSS.Math.Content.HSF.LE.A.3:
Observe using graphs and tables that a
quantity increasing exponentially
eventually exceeds a quantity increasing
linearly, quadratically, or (more
generally) as a polynomial function.
CCSS.Math.Practice.MP3:
Construct viable arguments and critique
the reasoning of others.
CCSS.Math.Practice.MP4:
Model with mathematics.

Lesson 8.1 Exponential Growth Models Day 2
This lesson is the second day of exponential growth model.
On day two, we will be working with applying the growth
model to word problems. I will be giving the students a new
formula they can use for application problems to create a
function as it relates to each word problem. The new growth
model is y=a(1+r)t where a is the initial amount, r is the
growth percentage as a decimal, t is the time, and y is the
end amount. I will also explain to the students that the
quantity (1+r) is known as the growth factor. After discussing
these notes, we will move to example problems to apply the
concepts. I will give the students a word problem and have
them tell me what information goes where in the formula.
Then once we have created a function, I will have them
graph it and have them solve for an end amount after a
given time. We will do this again with another problem to
practice. I will then ask the students how they are feeling
about the material by giving me a thumbs-up, thumbs-down,
or thumbs-sideways depending on how they feel. If the
students still seem to struggle with the concept, we will go
over another problem. If the students are understanding the
concepts then we will move to an activity.
For the activity for this lesson, I will write five different
exponential growth model functions on the board. The students
will choose one then graph the function and create a real-world
problem from the equation. The students will need to come up
with a scenario that will match the function. This will use MP4 for
the graphing and modeling and MP2 for reasoning abstractly and
creating a scenario from the equation. Once the students have
their scenario, they will share their word problem with their
neighbor and the neighbor must guess which function matches
the scenario. For example, student 1 and student 2 are paired up.
The students swap scenarios with the function covered or hidden.
Student 1 must guess which function student 2 choose and
explain their thinking, then they will repeat this with student 1’s
scenario. If either of them gets it wrong, they must guess again.
This gives the students a chance to show their understanding or
where they struggle. The students can help each other verify if
their answers are right and create great mathematic
conversations about exponential growth models.

Learning Targets:
I know about the exponential growth
model.
I can use the model to solve application
problems.
Common Core State Standard:
CCSS.Math.Content.HSF.LE.A.1.C:
which is about modeling exponential
functions and interpreting situations
that need to be solved with an
exponential model.
CCSS.Math.Content.HSF.LE.B.5
Interpret the parameters in a linear or
exponential function in terms of a
context.
CCSS.Math.Practice.MP2:
Reason abstractly and quantitatively
CCSS.Math.Practice.MP4:
Model with mathematics.

Lesson 8.2 Exponential Decay
For the final lesson in this learning progression, we will be
covering exponential decay. I will remind the students about
when I briefly mentioned how decay relates to growth on
the first day. I will ask the students to remind me of the
exponential function we used on the first day with the
transformations, which is y=ab(x-h)+k. I will then ask the
students to define each term in their own words. This gives
me a chance to assess whether or not the students were
taking notes and understanding the material. By having
them put it in their own words, it forces the students to
show an understanding of the concept rather than just
reading from their notes. I will also remind them that for the
function to be a decay model rather than a growth model,
the b value must be between 0 and 1. If the b value is above
1, we will have an exponential growth model. I will also
discuss the long term for the graph, as the t value gets large,
then the end amount or y value will get closer and closer to
zero but will never be zero, therefore having an asymptote
at y=0 or the x-axis. As long as the students do not have any
questions about this equation, we will move onto doing
some practice problems of graphing three different
functions with the same b value of ½ but each has different
transformations.
Once we are done graphing each example, I will ask the
students to remind me of the exponential growth model
they had learned the day before, which was y=a(1+r)t. For
decay the equation is nearly the same except the growth
factor is now a decay factor and is 1-r instead of 1+r,
therefore making the quantity less than 1. All the terms are
the same as in the growth model, however the r value is
now a decay rate as a decimal instead of a growth rate.
Thus, the decay model being y=a(1-r)t.
After comparing the growth model to the decay model, I will
give the students a class activity. I will give the students a
word problem to apply the decay model to. This will be a
three-part problem where they will write the decay model
based on the problem, then graph the model, and finally solve for the end value after 3 years.
Students will work on this individually then discuss it with their neighbor once most people are
done. Once everybody seems to be done discussing the problem, I will give them the answer to
the end value after three years to check their work. If they got this correct then their decay
model should be correct and they should be able to find this point on their graph is they look at
what the value of y is when x is 3. This allows the students to check their work without me
going over each part and giving them all the answers.

Learning Targets:
I can graph the exponential decay
function.
I can solve problems using the
exponential decay functions.
Common Core State Standard:
CCSS.Math.Content.HSF.LE.A.1.C:
which is about modeling exponential
functions and interpreting situations
that need to be solved with an
exponential model.
CCSS.Math.Content.HSF.LE.A.3:
Observe using graphs and tables that a
quantity increasing exponentially
eventually exceeds a quantity increasing
linearly, quadratically, or (more
generally) as a polynomial function.
CCSS.Math.Content.HSF.LE.B.5
Interpret the parameters in a linear or
exponential function in terms of a
context.
CCSS.Math.Practice.MP3:
Construct viable arguments and critique
the reasoning of others.
CCSS.Math.Practice.MP4:
Model with mathematics.

How does the slope change over time for a ball thrown in the air? F.IF & F.BF

This will be taught in a calculus class. Using the software and tools as shown in the following links: https://www.vernier.com/ https://www.vernier.com/products/software/lp/, the students will use the equipment to throw a ball in the air and track its position as time goes on. The students will use the data to draw a graph of position vs time for the ball and create an equation which give the position as it is related to the time. The students will then take the slope at different points and use the data to draw a slope vs time graph. They will also create a function for this graph. This will be an introduction activity to derivatives. The students will create a functions of the position vs time as well as create a function for the slope vs time. We will then go into covering the material for derivatives. The students will understand the procedure of how to create a function from a graph or data. They will also understand the concept of what a derivative is and how it relates to the real world problem I have provided. Below you will find the handout I will give the students to guide them through the activity.

The CCSS for this lesson are as follows:

  • CCSS.MATH.HSF-IF.B.4: Interpret functions that arise in applications in terms of context
  • CCSS.MATH.HSF-CED.A.2: Create equations that describe numbers or relationships.
  • CCSS.MATH.HSF-BF.A.1: Build a function that models a relationship between two quantities.


Ball Throwing Activity

Name:

Date:

  1. Set up your iPad such that it is far enough away to get a video of the ball as you throw it straight up in the air. You should make sure the ball stays in the view of the iPad when it is thrown for you should not move the iPad during the experiment.
  2. Open the Vernier Probes and Software program. Take a video of the ball as you lightly toss it straight up in the air.
  3. Sketch a graph of a position vs time for the ball in the space below. Create a function for this graph.


  1. Take the slope of the graph at t=0, at a point before the vertex, at the vertex, at a point after the vertex before the end, and finally at the point just before the ball hits the graph. What are the units of these slopes? What does this tell you about what the number means? Sketch a graph of the slopes as a time vs slope graph. Is it linear? What does that mean? Write an equation for the graph.


Hot Water vs. Boiling Water: Modeling with Linear Equations A.CED.A

A commonly asked question among students in math classes is “how will I ever use this in real life?” Math is extremely applicable to real world problems, but students do not always realize just how useful it can be.  For this reason, modeling real world, hands on problems is an extremely effective strategy to engage students in learning concepts, and it shows them the relevance of math concepts in the real world.  For this assignment, students will use Vernier temperature probes and a LabQuest2 to model and compare the temperature change of hot water and boiling water.

In this activity, students will use two temperature probes simultaneously to record the temperatures of boiling and hot water.  They will record the temperatures over the span of two minutes and use the LabQuest2 to generate linear equations for each cup of water (boiling and hot).  They will record the equation for each cup and graph the two lines on the same graph.  After recording their data, they will discuss and answer questions about the equations they found.  First, they will work with their partner to decide which cup of water is cooling faster.  Then they will compare the two lines and equations to determine whether the lines are parallel or intersecting and find where the two equations intersect.  Lastly, they will show their ability to create their own linear equation using two given points.  The students will display their understanding of the following CCSS by analyzing the real world data from the activity.

CCSS.MATH.CONTENT.HSA.CED.A.2
Create equations in two or more variables to represent relationships between quantities; graph equations on coordinate axes with labels and scales.

Vernier Probe Worksheet-2dfsi46

Weight Versus Time A-REI.B.3

How is the volume of water changing over time? When it comes to explaining volume and rate of change there are many possible ways to do this. By simply collecting weight data for a draining funnel students will be able to develop a model to illustrate the data collected. As the picture illustrate, it will be simple set up using a dual-range sensor to accomplish this lesson. 

The idea of the lesson is for the students to be able to understand rate of change and how it can be represented. Students will be able investigate using the proper equipment to answer questions such as at what rate is the water level decreasing? How long will it take for the funnel to drain completely?

Overall, students will be able to meet the objectives of recording the weight versus time data for a draining funnel and describe the recorded data using mathematical understanding of slope of a linear function.

Common Core State Standard:

HSA-REI.B.3. Solve linear equations and inequalities in one variable, including equations with coefficients represented by letters.

HSS-ID.C.7 Interpret the slope (rate of change) and the intercept in the context of the data.

HSS-ID.C.8 Compute (using technology) and interpret the correlation coefficient of a liner fit.

Bridge Modeling F.LE.A.1

CCSS.MATH.CONTENT.HSF.LE.A.1

Distinguish between situations that can be modeled with linear functions and with exponential functions.

The Problem:

We begin the lesson with introducing (or reminding) students of the concept of a function. For the purposes of this lesson, we will define a function as an expression containing one or more variables in which each input has one and exactly one output.


It is also understood that before continuing with the lesson, students are aware of at least the basic shape of some basic graphs: linear, quadratic, polynomial, exponential, logarithmic, and sinusoidal.


Once the understanding has been established, we introduce the lesson objective to the students: for them to create a functional model for determining the breaking weight of paper bridges by predicting a best-fit graph.


To complete their task, students are given at least 10 strips of paper measuring 11”x4”. They will also require about 40 pennies, as well as two books of about the same thickness. Students will make a one inch fold along both of the long sides to create a bridge, then suspend their bridge between the two books, as shown below.

Students will then stack pennies on their bridge. Eventually their paper bridge will fall, and students will record the number of pennies their bridge was able to hold before falling. Once that number is recorded, that paper bridge is “retired”. Students will then take two strips of paper stacked on top of each other, create the same 1-inch fold along both of the longer sides, and suspend their new 2-layer bridge between the books. Students will again begin stacking pennies on their paper bridge, recording the number of pennies their bridge was able to hold when it falls. They will continue their process for 3 layers of paper, as well as at least 4 and 5 layers but continuing to as many layers as desired.


Once the data has been collected, students will use their calculator to input the values into the scatterplot and analyze their graph to determine a best-fit equation.


Our Approach:

Our experiment went well for our first three trials, that is the 1, 2, and 3 layer bridges. We found that for the 1-layer bridge we were able to hold 8 pennies. The 2-layer bridge held 16 pennies and the 3-layer bridge held 27. The difference between the first two values is 8, while the difference between the last two is 11. The differences are close enough that it could suggest a linear regression, although with three points it is hard to tell, and we concluded further testing was required.


Our fourth trial resulted in a paper bridge capable of withstanding 68 pennies. This was a difference of 41 from the 3-layer bridge, and threw our theory of a linear regression out the window. We went back to the differences between the first few data points, and although the differences were similar we realized the first difference is smaller than the second difference. We used a calculator to plot the four points, and to create an exponential regression.


However, we were hesitant to accept this result. Was our outcome for the 4-layer bridge a fluke, or a statistically significant event? We continued creating and testing 5, 6, and 7 layer bridges, and found that they were able to hold 45, 55, and 65 pennies, respectfully. The consistency of differences immediately told us that we are not, in fact, dealing with an exponential function. We went back to our original idea of a linear function, excluding our 4th trail’s data completely.


Because of our uncertainty, we decided to determine our margin of error. We used the equation for our linear function to “predict” what our outcome should have been for the 1-3 and 5-7 layer bridges, and we determined as follows: 

Trial # # of pennies bridge held # of pennies bridge should have held (following linear equation) Difference
1 8 7.5 .5
2 16 17 1
3 27 26.5 .5
5 45 45.5 .5
6 55 55 0
7 65 64.5 .5

By adding the differences and dividing by 6 (our number of data points), we get our average difference between the points and the linear regression line of 0.5. This means that we could estimate the number of pennies a 100-layer bridge could withstand, and our number would be accurate within ½ of a penny.

Disney World needs a new Roller-coaster! by Emily Ivie

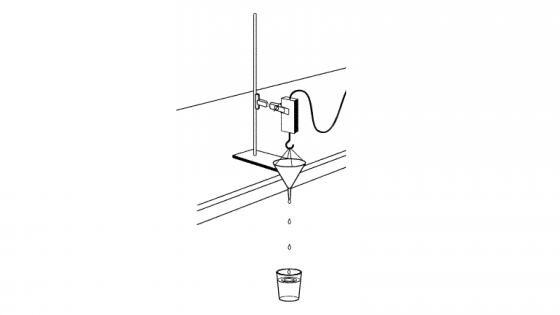
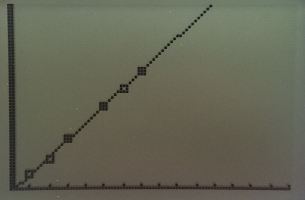
Learning Target – I will be able to use a motion detector to match and then create a time-distance graph. Represent two numerical variables on a scatter plot and describe any correlation and/or relationship between the two variables.

Common Core Standards: CCSS.Math.Content.HSF.IF.B.4, CCSS.Math.Content.HSF.IF.C.7.

Idea of the Lesson:

When students are introduced to the idea of slopes and rates, it is important to emphasize the application of slops and rates to the real world and the technology we can use to model this. The activity will help students connect the idea between slopes and roller-coasters. Then students will use a CBR, link cable, and graphing calculator with Easy data app downloaded to create a virtual roller-coaster. The benefit of this activity is that this is a real-world example of a job you can get with a math degree. The worksheet will be presented as a mathematician’s design of a roller-coaster. The students will also have to write up a conclusive “business proposal”.

Procedures:

  • Teacher will remind students of a time distance graph.
  • Create groups of 2 students each.
  • Students will draw their ideal roller-coaster with no flips (each student draws their own, does not need to match their partner).
  • Students will use CBR with calculator to create a simulation of their roller-coaster to match the slope while their partner runs the start/stop button.
  • Write up their business proposal using proper vocabulary

Activity’s worksheet

Let’s Temp. Our Way Through Linear Equations HSA-CED.A.2

Math teachers are always wondering on how to use real world problems in any mathematical lesson. I think that a good way to do this is to do something that will get the attention of all students and do something they can all engage in. For this assignment we will be using the LabQuest2 and two temperature probes to measure the temperature of a cup of hot water using both Fahrenheit and Celsius.

Image result for dueling temperature probes labquest2

This will be done by connecting the two temperature probes  into channel 1 and 2 of the Labquest2. The students will then turn it on and go to the home button. They will then select the red temperature and make it Celsius and select the blue temperature and make it Fahrenheit. Once they do this they will get the cup of hot waterImage result for cup of water  
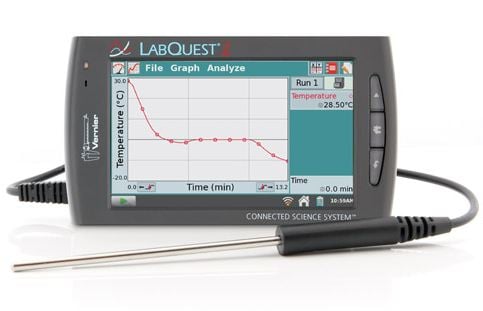
and insert the probes inside then they will select the green arrow that will be shown on the bottom left hand corner of the screen to collect the temperatures for both Celsius and Fahrenheit. After 1 minute the students will stop the collecting the data by pressing the red rectangle. Then they will go to the analyze menu and select curve fit. Then they will select the red temperature and then click linear and write down their regression equation on the worksheet handed out to them for Celsius and then repeat for the blue temperature(Fahrenheit). The students who will be in groups of three will compare and contrast these temperatures graph them both on a piece of paper and then form a linear equation for both of the different scales. Then the students will use the information to tell whether the equations are the same, parallel, or intersecting and if they intersect where?
The assignment relates to the Common Core Standard
CCSS.MATH.HSA-CED.A.2 Creating equations that describe numbers or relationships

Lets temp our way through linear equations worksheet-pca5rc

How to Conceptualize Functions HS. FB

When students first see a set of ordered pairs, a table containing data, or a function representing this data, their first thought may be that these are just numbers on a page that are written in an organized way.  When this is a student’s first understanding of this information I believe that they are missing the point of the data.  Ordered pairs, tables of data and functions are really ways of graphing and representing real-world occurrences.  In this activity students will go from a real-world occurrence and will then decontextualize the results so that they can describe the rate of change of an object.  In this activity, students will take videos using an app produced by Venire, Video Physics, of the projectile motion of a ball rolling off of a table.  They will then take the points that they gather using the features of the app to find the average rate of change of the ball as it falls.  Students will do three trials of rolling the ball off of the table.  During each trial the students will change the amount of force that they use while causing the ball to roll off of the table.  After students have used the app to graph the motion of the ball, they will be able to use what they know about finding the slope between two points on a graph to notice the changes between the three graphs.  By connecting their procedural knowledge of how to find a slope between points to this real-world model of the mathematics, students will come to better understand how the mathematics that they are learning is truly a part of their everyday lives.

CCSS.MATH.CONTENT.5.G.A.2
Represent real world and mathematical problems by graphing points in the first quadrant of the coordinate plane, and interpret coordinate values of points in the context of the situation.

CCSS.MATH.CONTENT.HSF.IF.B.6
Calculate and interpret the average rate of change of a function (presented symbolically or as a table) over a specified interval. Estimate the rate of change from a graph.* 

CCSS.MATH.PRACTICE.MP4

Model with mathematics.

Venier worksheet


Bouncing Into Math CCSS.MATH.5.G.A.2

Some math teachers might ask the question “how can I adapt this curriculum to relate to real world scenarios?” One way to start is by taking an interest in what your students are interested in. There’s a time for lecture and there’s a time for, well, bouncing balls and having fun. This activity features measurement of a tennis ball bouncing and when it slows down, compared to a rubber ball bouncing and when it slows down, using the Ipad app called Video Physics. You might be asking yourself now “how in the world does this relate to the real world?” Well, once this activity is performed by questioning young minds, the students will want to know more. They’ll want to use the technology and math and relate it to people and if they were to keep jumping, at what point would those bounces become smaller and slower. This is an activity to get the students up out of their seats and “perform” mathematics in the classroom.

In this activity the students will need to get into groups of at least three and have an Ipad, a worksheet, a tennis ball, and a rubber ball. Each student will have his/her own job: recorder, video-taper, and ball bouncer. Each student will get to perform each task within the groups of three. The students will collect and record data pertaining to the tennis ball and the rubber ball and how each ball’s acceleration and height of the bounces differ slightly. Prior to the students gathering data, they will draw their prediction of what each ball’s graph will look like. This will give the students more insight to how the math aligns with reality. After they complete the worksheet given during this lesson, the class can discuss their findings as well as how else they could use this technology in their day to day lives.

This assignment relates to the Common Core State Standard

CCSS.MATH.5.G.A.2 Graph points on the coordinate plane to solve real-world and mathematical problems.

Bouncing Into Math Worksheet-1oj7bir

Crossover Between Exercise and Mathematics F.F-IF.4

Many students are not quiet about their opinions of a typical math class, one where the teacher lectures, the students write notes and there’s time at the end to work on the homework. While there may be a need for this sometimes, this is not the most efficient way to get students engaged in the class and the lesson.

An easy way to mix things up and increase student engagement is by implementing an activity, other than a basic worksheet to complete. With all the technological advances occurring all around us, it’s important that we expose our students to some of these new technologies especially when they relate to math.

Students learn best and engage when the activity and topics can be related to their life or daily activities. This is where the “Crossover between Exercise and Mathematics” activity comes into play. Even if not all students enjoy exercise, they are all familiar with it because they are required to take a certain number of gym credits in high school.

Image result for CBR 2In this activity students are to use a Vernier CBR 2 Motion Detector with a compatible TI graphing calculator, either a TI-83 or TI-84. The students will work in groups of three to complete this math exercise activity. They will have to come up with an exercise were they can measure distance and amount of time while they are performing it.

The students will take turns with each person performing the exercise, operating the equipment, and recording the information on their worksheet.

Once the students have decided on the exercise to perform they will make a prediction of what their graph of distance over time will look like. The distance will be graphed on the y-axis and the time on the x-axis.

Once their prediction graph is drawn they will use the Vernier CBR 2 motion detector and TI graphing calculators to create a graph of the exercise. After using the software and getting the graph, the students will record the graph onto their sheet and explain the differences between their graph and the graph done by the software. They can also explain which aspects of the exercise are visible in each part of the graph. For example, if the exercise is pushups then the graph would go up and down and the peaks would be when the person is in the fully extended position of the push-up. And the down of the pushup would be in the valley of the graph.

This activity relates to the following Common Cores State Standard:

CCSS.MATH.HSF.F-IF.4

For a function that models a relationship between two quantities, interpret key features of graphs and tables in terms of the quantities, and sketch graphs showing key features given a verbal description of the relationship. Key features include: intercepts; intervals where the function is increasing, decreasing, positive, or negative; relative maximums and minimums; symmetries; end behavior; and periodicity.

Connection Between Exercise and Math worksheet