Yeah He Caught It, But How Far Was It? 8.G.B.7

Problem: For this lesson, students will be doing an extreme version of utilizing the Pythagorean Theorem. The number in the picture, 400ft, is the distance from home plate to dead center field at Miller Park in Milwaukee, Wisconsin. The goal of the lesson is for students to find the distance of the ball when it is caught by Keon Broxton. Almost all of the information is present in the picture without much background knowledge, but they will also be told that he was estimated to be about 4ft off of dead center when he caught the ball.

The beginning of the lesson will have students discussing what information they have and what information they will need to complete the assignment. The groups will realize that they need to use the Pythagorean Theorem to solve the problem. The groups will come together for a class discussion and asked what information they still need.

After that, students will do their own research to find the missing components. These components are things like where in the stadium the ball was caught, where the ball was when it was caught, etc. The students will use this information to solve the problem, and present to the class how they solved the problem and how they found the missing information.

Connected Math Standards:

CCSS.MATH.CONTENT.8.G.B.7
Apply the Pythagorean Theorem to determine unknown side lengths in right triangles in real-world and mathematical problems in two and three dimensions.

CCSS.MATH.CONTENT.8.G.B.8
Apply the Pythagorean Theorem to find the distance between two points in a coordinate system.

Extension: If students are grasping the content quickly, have them estimate the angle at which the ball entered Keon Broxton’s glove. This can be done using basic trigonometry, which is referenced in the standard CCSS.MATH.HSG.SRT.D.10. While this is technically beyond their grade level, they have a lot of the background knowledge needed to solve the problem so long as they have the height of the ball at the apex of its flight.

Cultural Relevance: This lesson is culturally relevant because baseball is widely played around the world, especially in Hispanic cultures like Mexico, Puerto Rico, Costa Rica, and especially in the Dominican Republic. Plus many students idolize baseball players in a way that they will like the opportunity to do extra research with certain players in them.

Standard from Another Content Area:
WA.EALR.5.4.1
Uses sources within the body of the work to support positions in a paper or presentation.

This standard will be used when students are finding extra information for the assignment.

El Castillo (Temple of Kukulkan) 7.G.3

Related image

Math Standard:

CCSS.Math.7.G.3 – Describe the two-dimensional figures that result from slicing three-dimensional figures, as in plane sections of right rectangular prisms and right rectangular pyramids.

Math Problem:

With this standard and picture, I would have students look at the different ways that this pyramid could be sliced. With each slice that they think of, I would have them draw  what the pyramid would look like from the side and top view based off of every slice they would make. This would be done in partners and  each partner group would have to come up with at least two ways that the pyramid could be sliced. As an extension, I would ask them to show what the pyramid would look like if they sliced it more than once.

Integration:

Science Standard:

MS-ESS1-1 Earth’s Place in the Universe – Develop and use a model of the Earth-sun-moon system to describe the cyclic patterns of lunar phases, eclipses of the sun and moon, and seasons.  [Clarification Statement: Examples of models can be physical, graphical, or conceptual.]

Science Problem:

After students have had the chance to look at this pyramid from different points of view as a whole piece and as slices, I would have them use the pyramid to show how the earth, sun, and moon rotate together. They would be in groups of four and have to build a physical representation of the pyramid. After they got their pyramid created, they would draw placements of the sun, moon and earth in which they would have to explain in a presentation to the class where each would be and how the placements of the earth, sun and moon would change the way the pyramid would look (e.g shadows). No one pyramid would look the same because Students would all have drawn different placement of the sun, moon and earth from the hat. After each group has presented, we then decide as a class what group’s pyramid representation would be first if we were look at it at 7:oo am and who would be next until we got to the last pyramid representation.

How this problem teaches culturally:

This problem teaches culturally because throughout this integrated unit, we would have conversations of how the pyramid was created and how the Mayans used it. We would also talk about where the pyramid is located and what the culture was like when the pyramid was built.

Mystery (Function) Machine F-IF.1&7

CCSS.MATH.F-IF.1

Understand that a function from one set (called the domain) to another set (called the range) assigns to each element of the domain exactly one element of the range. If f is a function and x is an element of its domain, then f(x) denotes the output of f corresponding to the input x. The graph of f is the graph of the equation y = f(x).

CCSS.MATH.F-IF.7.a

Graph functions expressed symbolically and show key features of the graph, by hand in simple cases and using technology for more complicated cases.★

  1. Graph linear and quadratic functions and show intercepts, maxima, and minima.

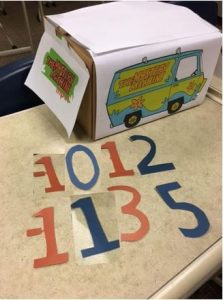
The math concept that is the focus of this picture problem is functions. The math thinking that can take place via this picture problem includes simplifying, analyzing patterns, and synthesizing the information followed up by representing the information in a variety of ways. For starters, the student can simplify what is represented in the picture. They can pull out the numbers and then they can realize from the mystery machine that they will be evaluating a function. They can analyze the pattern between the numbers that will give them the equation of the function. Then they will represent their synthesis of the information in a variety of ways including a table and a graph. Their processes will be evaluating the given number and coming up with an equation for it. Then they will have to determine the graph from either the points or the equation.

The picture brings relevance because in this unit students have been learning about functions and the curriculum will frequently use the concept of a function machine to describe how each input has only one output. As students are already familiar with the concept of a function machine, so bringing in a physical model such as the Mystery Machine Function Machine or even the above photo of the Mystery Machine Function Machine will be very relevant to what they are learning. As for engagement, this will also get students engaged because they will have to take what is supplied in the photo and compile it into a table, establish what the function is and then graph it. Teachers can put the picture on the board and then ask the students to do what they think they should do with what is supplied in the picture or the teacher can give them explicit directions.

Crossover Between Exercise and Mathematics F.F-IF.4

Many students are not quiet about their opinions of a typical math class, one where the teacher lectures, the students write notes and there’s time at the end to work on the homework. While there may be a need for this sometimes, this is not the most efficient way to get students engaged in the class and the lesson.

An easy way to mix things up and increase student engagement is by implementing an activity, other than a basic worksheet to complete. With all the technological advances occurring all around us, it’s important that we expose our students to some of these new technologies especially when they relate to math.

Students learn best and engage when the activity and topics can be related to their life or daily activities. This is where the “Crossover between Exercise and Mathematics” activity comes into play. Even if not all students enjoy exercise, they are all familiar with it because they are required to take a certain number of gym credits in high school.

Image result for CBR 2In this activity students are to use a Vernier CBR 2 Motion Detector with a compatible TI graphing calculator, either a TI-83 or TI-84. The students will work in groups of three to complete this math exercise activity. They will have to come up with an exercise were they can measure distance and amount of time while they are performing it.
The students will take turns with each person performing the exercise, operating the equipment, and recording the information on their worksheet.

Once the students have decided on the exercise to perform they will make a prediction of what their graph of distance over time will look like. The distance will be graphed on the y-axis and the time on the x-axis.

Once their prediction graph is drawn they will use the Vernier CBR 2 motion detector and TI graphing calculators to create a graph of the exercise. After using the software and getting the graph, the students will record the graph onto their sheet and explain the differences between their graph and the graph done by the software. They can also explain which aspects of the exercise are visible in each part of the graph. For example, if the exercise is pushups then the graph would go up and down and the peaks would be when the person is in the fully extended position of the push-up. And the down of the pushup would be in the valley of the graph.

This activity relates to the following Common Cores State Standard:

CCSS.MATH.HSF.F-IF.4

For a function that models a relationship between two quantities, interpret key features of graphs and tables in terms of the quantities, and sketch graphs showing key features given a verbal description of the relationship. Key features include: intercepts; intervals where the function is increasing, decreasing, positive, or negative; relative maximums and minimums; symmetries; end behavior; and periodicity.

Connection Between Exercise and Math worksheet

Shape Sorter 6.SP.B

By Rachel Van Kopp, Kimberly Younger, Tracy Van Lone, Natasha Smith, and Naomi Johnson

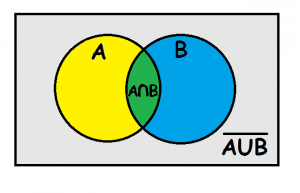
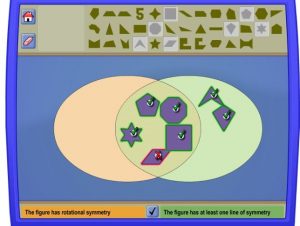
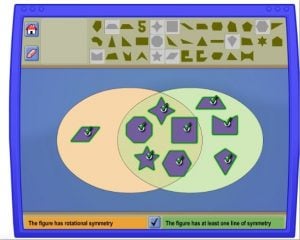
CCSS.MATH.CONTENT.7.G.A.3In the NCTM shape sorter activity, students use aVenn diagram to understand concepts of sorting geometric shapes by categories. For this activity our group of pre-service teachers sorted figures based on these parameters: 1. the figure has rotational symmetry and 2. the figure has at least one line of symmetry. Our group came up with two rules that we found to be true:

  1. All regular polygons have at least one line of symmetry
  2. All parallelograms  have rotational symmetry, but not a line of symmetry with the exception of the rectangle.

The following images are examples of attempts our group has made with the given categories.


Common misconceptions: Some common misconceptions with the categories has one line of symmetry and has rotational symmetry is that parallelograms have a line of symmetry. This is actually not true because no matter where the line is drawn on every parallelogram, except a regular trapezoid and rectangles, the angles will be off-set. Another misconception is that all figures with rotational symmetry have a line of symmetry. This is also untrue because parallelograms have rotational symmetry, but no line of symmetry.

To bring this activity in the classroom, we created a lesson warm-up and the worksheet pictured below, which can be download here. The warm-up (which is available via the link but not pictured) focuses students on relevant geometric vocabulary, and the worksheet serves as an activity tracker, helping students make connections between geometric concepts and sets and logic learning via their activity on the NCTM Shape-Sorter app.