CCSS.MATH.CONTENT.HSF.LE.A.1
Distinguish between situations that can be modeled with linear functions and with exponential functions.
The Problem:
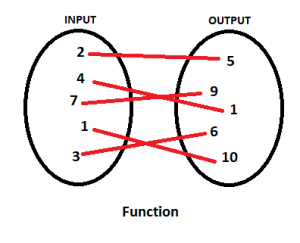
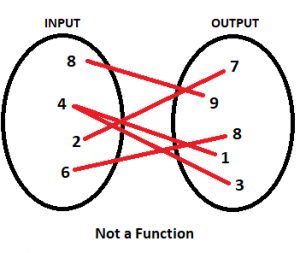
We begin the lesson with introducing (or reminding) students of the concept of a function. For the purposes of this lesson, we will define a function as an expression containing one or more variables in which each input has one and exactly one output.
It is also understood that before continuing with the lesson, students are aware of at least the basic shape of some basic graphs: linear, quadratic, polynomial, exponential, logarithmic, and sinusoidal.
Once the understanding has been established, we introduce the lesson objective to the students: for them to create a functional model for determining the breaking weight of paper bridges by predicting a best-fit graph.
To complete their task, students are given at least 10 strips of paper measuring 11”x4”. They will also require about 40 pennies, as well as two books of about the same thickness. Students will make a one inch fold along both of the long sides to create a bridge, then suspend their bridge between the two books, as shown below.
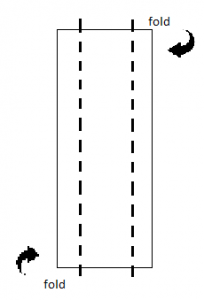

Students will then stack pennies on their bridge. Eventually their paper bridge will fall, and students will record the number of pennies their bridge was able to hold before falling. Once that number is recorded, that paper bridge is “retired”. Students will then take two strips of paper stacked on top of each other, create the same 1-inch fold along both of the longer sides, and suspend their new 2-layer bridge between the books. Students will again begin stacking pennies on their paper bridge, recording the number of pennies their bridge was able to hold when it falls. They will continue their process for 3 layers of paper, as well as at least 4 and 5 layers but continuing to as many layers as desired.
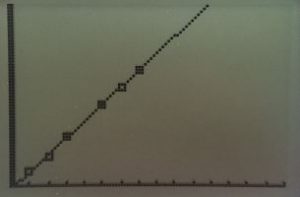
Once the data has been collected, students will use their calculator to input the values into the scatterplot and analyze their graph to determine a best-fit equation.
Our Approach:
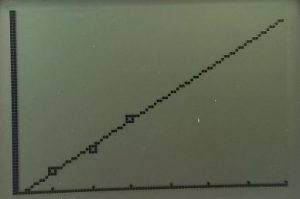
Our experiment went well for our first three trials, that is the 1, 2, and 3 layer bridges. We found that for the 1-layer bridge we were able to hold 8 pennies. The 2-layer bridge held 16 pennies and the 3-layer bridge held 27. The difference between the first two values is 8, while the difference between the last two is 11. The differences are close enough that it could suggest a linear regression, although with three points it is hard to tell, and we concluded further testing was required.
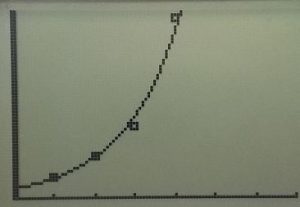
Our fourth trial resulted in a paper bridge capable of withstanding 68 pennies. This was a difference of 41 from the 3-layer bridge, and threw our theory of a linear regression out the window. We went back to the differences between the first few data points, and although the differences were similar we realized the first difference is smaller than the second difference. We used a calculator to plot the four points, and to create an exponential regression.
However, we were hesitant to accept this result. Was our outcome for the 4-layer bridge a fluke, or a statistically significant event? We continued creating and testing 5, 6, and 7 layer bridges, and found that they were able to hold 45, 55, and 65 pennies, respectfully. The consistency of differences immediately told us that we are not, in fact, dealing with an exponential function. We went back to our original idea of a linear function, excluding our 4th trail’s data completely.
Because of our uncertainty, we decided to determine our margin of error. We used the equation for our linear function to “predict” what our outcome should have been for the 1-3 and 5-7 layer bridges, and we determined as follows:
| Trial # | # of pennies bridge held | # of pennies bridge should have held (following linear equation) | Difference |
| 1 | 8 | 7.5 | .5 |
| 2 | 16 | 17 | 1 |
| 3 | 27 | 26.5 | .5 |
| 5 | 45 | 45.5 | .5 |
| 6 | 55 | 55 | 0 |
| 7 | 65 | 64.5 | .5 |
By adding the differences and dividing by 6 (our number of data points), we get our average difference between the points and the linear regression line of 0.5. This means that we could estimate the number of pennies a 100-layer bridge could withstand, and our number would be accurate within ½ of a penny.
