Extended Mathematical Practice: Learning About Numerics, Base Systems, and Modular Arithmetic Outside of the Curriculum – MP 1,3,7,& 8

Learning Progression for edTPA – Extended Mathematics

Standards:

  • CCSS.MP-1 – Make sense of problems and persevere in solving them.
  • CCSS.MP-3 – Construct viable arguments and critique the reasoning of others.
  • CCSS.MP7 – Look for and make use of structure.
  • CCSS.MP-8 – Look for and express regularity in repeated reasoning.

Task Summary: Students will be given an inquiry prompt to answer as students work through activity sheets that will have students finding values of numbers in ancient systems (e.g. Egyptian, Babylonian, Mayan), different bases, and in modular expressions. Students will also find solutions for addition and subtraction problems in different bases and with modular arithmetic. Students will also discuss their ideas, findings, and questions using mathematical thinking and reasoning. These tasks are designed to develop students’ mathematical thinking and reasoning.

Assessment Task Summary: Students will be assessed on their mathematical thinking and reasoning by their written work or mathematical discourse. Scoring of the assessment will be done via a rubric based on the standards above and learning targets for each task.

Learning Progress: Intro to Stats and Data – CCSS.Math.HS.ID

Learning Progression

Standards address:

HS.ID.A.1 – Represent data with plots on a real number line (dot plots, histograms, and box plots).

Task examples:

  • Read and contextualize graphs and tables
  • Analyze how data is represented (e.g. “Is this the best graph for this data?”)
  • Create graphs and tables for data sets and give reasoning.

HS.ID.A.2 – Use statistics appropriate to the shape of the data distribution to compare center (median, mean) and spread (interquartile range, standard deviation) of two or more different data sets.

Task examples:

  • Contextualize the skew of data
  • Calculate interquartile ranges, standard deviation, and distribution
  • Create a graph – or data set – that represents a given description

HS.ID.A.3 – Interpret differences in shape, center, and spread in the context of the data sets, accounting for possible effects of extreme data points (outliers).

Task examples:

  • Identify outliers
  • Create graphs and/or tables for two data sets and compare them

Assessments:

  • Student discourse
  • Mathematical reasoning
  • Use of visuals
  • Contextualizing to personal examples/experiences
  • Hinge questions

Finding Properties of Scale Factor G-SRT.1

Assessment Task:

Solve the following problems based on the pictures given. You may use a calculator. Show work and answers on separate piece of paper. Use units when appropriate.

  1. What scale factor makes the sides of B equal the sides of A?
  2. What scale factor makes the area of B equal the area of A?
  3. The squares are now cubes. What scale factor makes the volume of B equal the volume of A?
  4. What is the relationship do you see between the scale factors of side length, area, and volume? Describe that relationship as a ratio and in words. Do you think this will always work? Why?

Finding Properties of Scale Factor Task, Commentary, and Solutions

CCSS.Math.HS.G-SRT.1 “Verify experimentally the properties of dilation given by a center and a scale factor”

Using Lines to Solve Systems CCSS.Math.HS.A-REI.6


The picture above was created using Desmos, a free to use graphing application. I created this imagine to use in a lesson about solving linear systems. I wanted an image that students could easily recognize and create equation from. The picture can be aligned with CCSS.Math.HS.A-REI.6, “Solve systems of linear equations exactly and approximately (e.g., with graphs), focusing on pairs of linear equations in two variables.” The picture can be used in a task that has students find equations for the lines and finding the ordered pair for the intersection. Students can then find a think about a way to find the ordered pair algebraically.

The picture is a nice starting place for this learning. It gives students a visual representation of the solving systems concept, and it has students build up from what they already know.

Here is the lesson plan and associated worksheet for the picture above.

Introducing Calculus Through Exploration of Motion CCSS.Math.HS.F-IF.6

Calculus is notorious for frightening students away from higher math and because it is “too difficult” or “too abstract”. This does not have to be the case. Calculus can be made approachable and tangible.

The idea for the lesson below introduces rate-of-change to students with hands-on engagement. Students will be analyzing the motion of a ball to understand how physical objects experience rate-of-change.

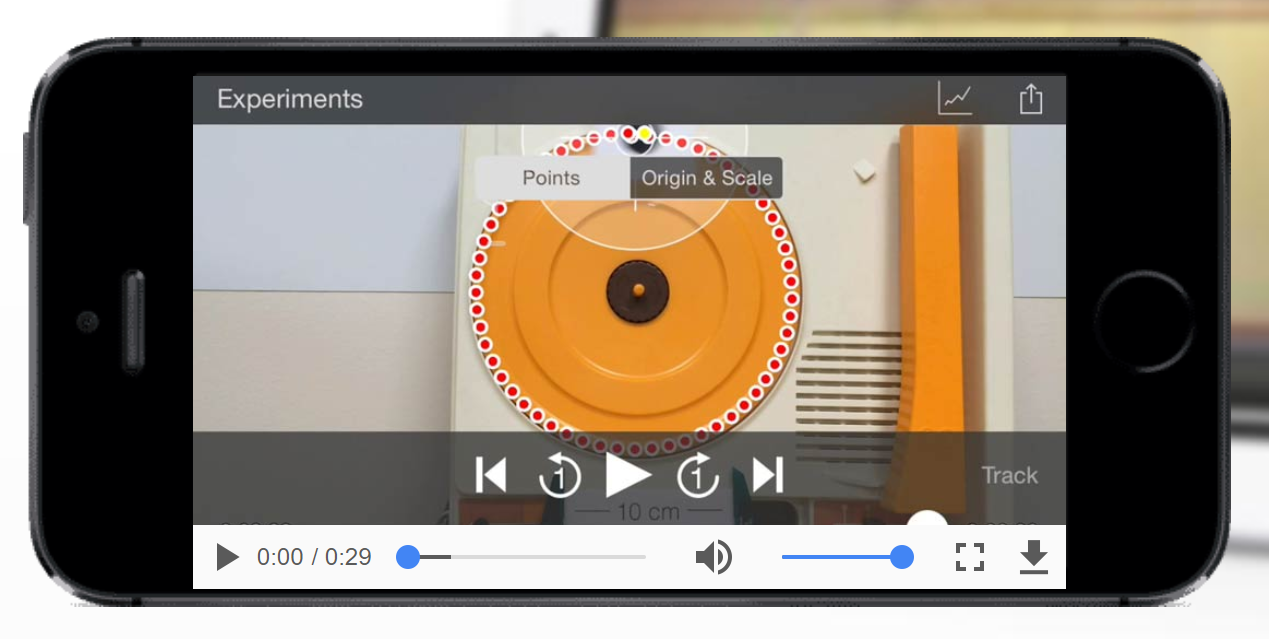
For this exercise, students will need to form small groups. Each group will be given a worksheet (how many is at the digression of the teacher), a small ball that should fit comfortably in one hand, a foot-long ruler, and an iPad with the Video Physics app installed on it. Video Physics is an app created by Vernier. The app can only be installed on Apple devices, and will cost $4.99. However, if the app is purchased, it should be easy to install on all of the iPads if they are all linked to the same account. More information can be found here.

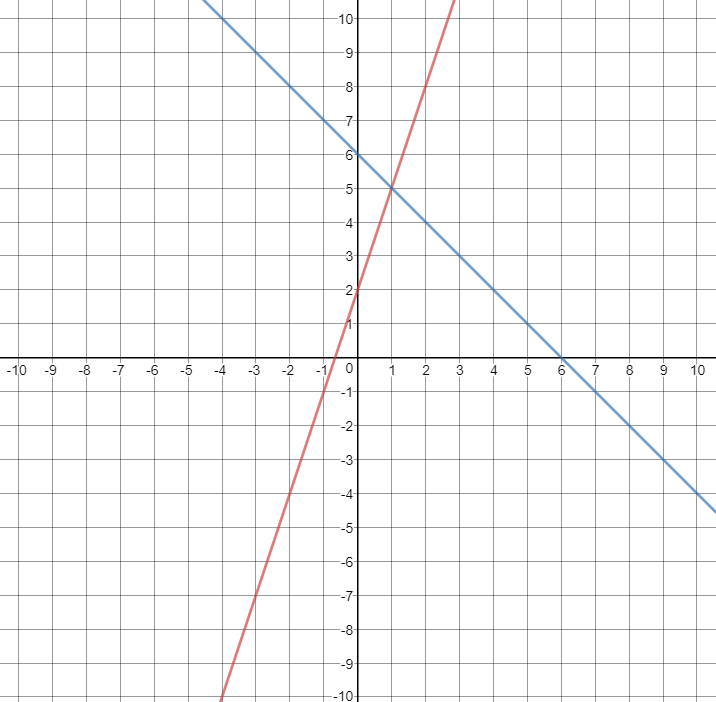
Groups will use Video Physics to videotape the ball rolling off a desk and observe its velocities in the x and y-directions. Based off the videotape, and some student input, the app will produce two graphs with equations: rate of change along the x-axis, and rate of change along the y-axis. Based on this information, students will fill in two plot maps with vectors representing the velocity for each axis. Students will notice that the velocity of the ball along the x-direction does not change, but along the y-direction it does. Furthermore, this change can be graphed using the slope formula!

By using tools students already have, calculus can be easily introduce by showing rate-of-change with velocities relationship to acceleration. Students won’t be working out derivatives or integrals of equations in this lesson, but understanding rate-of-change can be measured is a large conceptual hurdle that will be met by this lesson.

Pre-made Material: AnalyzingMovementExercise_Worksheet-1kw8fvm

Common Core associated with this lesson:

  • CCSS.Math.HS.F-IF.4 – For a function that models a relationship between two quantities, interpret key features of graphs and tables in terms of the quantities, and sketch graphs showing key features given a verbal description of the relationship.
  • CCSS.Math.HS.F-IF.6 – Calculate and interpret the average rate of change of a function (presented symbolically or as a table) over a specified interval. Estimate the rate of change from a graph.