ID. A Box and Whisker Plot Learning Progression

Box and whisker plots can be fun to learn while being interactive. This learning progression covers data representation with the five number summary, compare center and spread of different data, look at the effect of outliers, and recognize possible trends in data.

The Common Core State Standards aligned to this learning progression are:

CCSS.MATH.CONTENT.HSS.ID.A.1: Represent data with plots on the real number line (dot plots, histograms, and box plots).

CCSS.MATH.CONTENT.HSS.ID.A.2: Use statistics appropriate to the shape of the data distribution to compare center (median, mean) and spread (interquartile range, standard deviation) of two or more different data sets.

CCSS.MATH.CONTENT.HSS.ID.A.3: Interpret differences in shape, center, and spread in the context of the data sets, accounting for possible effects of extreme data points (outliers).

CCSS.MATH.CONTENT.HSS.ID.B.5: Summarize categorical data for two categories in two-way frequency tables. Interpret relative frequencies in the context of the data (including joint, marginal, and conditional relative frequencies). Recognize possible associations and trends in the data.

This learning progression includes assessments that help evaluate the students’ progress. There are activities that involve group work, pair work, and individual work.

Here is the learning progression and lesson plan:

Allie Hernandez Learning progression

Reaction Time Lesson Plan

6.RP.3 Shower v. Bath

Shower v. Bath

The 3-acts math task, “Shower v. Bath,” by Dan Meyer can be found at http://mrmeyer.com/threeacts/showervbath/.

This activity is aligned to:

  • CCSS-Math 6.RP.3: Use ratio and rate reasoning to solve real-world and mathematical problems, e.g., by reasoning about tables of equivalent ratios, tape diagrams, double number line diagrams, or equations.

The first act is a split screen video of a guy sitting in the bath on the bottom part of the screen and him standing in the shower in the top part of the screen.  Underneath the video, there is a question: “which do you think is cheaper: a shower or bath? Why?” The second act has a video of the duration of the shower and bath. The guy takes a shower in about 2 minutes and 24 seconds and takes a bath in about 8 minutes and 10 seconds.  There is also a video of the water rate in minutes per gallon for the bath and the shower.  It takes the faucet for the bath only about 11 seconds to fill up a one-gallon jug and it takes the shower head about 27 seconds.  Then under the videos there is an image of the cost of water in Mountain View, CA.  The third act has four questions: “how would the situation have to change for the answer to reverse itself,” “how long of a shower can he have with the same amount of water he used for the bath,” “which is cheaper for you? Collect data on your own shower and bath usage,” and “which is cheaper for your class? Average the data from all your classmates.”

For the lesson, I would introduce the activity by showing my students the first act video and ask them which they think would be cheaper. A good way for the students to actively participating in the activity is to give each of the students white boards. This way they can write either bath or shower and hold up their prediction and I can choose a few students to explain why they chose their prediction.  This will get the students thinking what option would use more water and what factors go into figuring out this problem. I will have the students brainstorm what information they are going to need in order to be able to get an answer in the end. From here I will show the video of how long it takes for the man in the video to shower and bathe and how long each option takes to fill up a gallon jug. This will be a good problem for the students to really think and work through the problem.

I will formally assess the students by having each student create a small poster with comparing their data to their classmate’s data. This will have the students making graphs, charts, finding averages, and making comparisons. From the poster, it will be clear if they met the learning target.

F-IF.B.6- Walking Rate

Technology is a way to get the students in an active role rather than a passive role when receiving information. The student is able to actively make choices about hot to generate, manipulate, and display information. Technology allows the students to be actively thinking about information, making choices, and executing skills than in a teacher-led lesson, which is usually lecture. This technology will have the students acquire the basic understanding of how various software, computer tools, and devices work. This will give the students confidence about being able to use these new tools later on, possibly in their work area. With society advancing at a rapid pace, it is very likely that the student’s future careers will incorporate some form of technology.

At www.vernier.com, there is a good example of a tool that the students can use. This is the Vernier Motion Detector. This motion detector can be purchased on their website for $79. The motion detector uses ultrasound to measure the position of carts, balls, people, and many other objects. This device can measure objects as close as 15cm and as far away as 6m. It also is able to attach to a graphing calculator to graph motions.


The Motion Detector will give the speed of the walker versus time. The students can work with rate=distance traveled/ time interval. The students could also work backward. For example, if the speed or rate of walking, and the time then the students can find the distance traveled using rate*time=distance. The student’s results will create their own linear equation by walking at a constant rate with using the motion detector to record their data. With the graph, the students can observe what kind of graph was created. There will be a worksheet provided that guides the students through steps to complete the experiment. The hand out has a table where they can keep track of their data. The handout can be found here: http://www.vernier.com/files/sample_labs/RWV-11-DQ-walk_this_way.pdf


This activity aligns to IF.B.6: Calculate and interpret the average rate of change of a function (presented symbolically or as a table) over a specified interval. Estimate the rate of change from a graph.

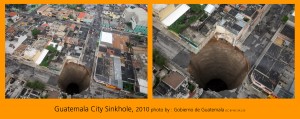
G.GMD- Guatemalan Sinkhole

Picture Problem

2010 Guatemala Sinkhole


Common Core State Standards:

G-GMD.3- use the formulas for cylinders, pyramids, cones, and spheres to solve problems.

G-MG.1- use geometric shapes, their measures, and their properties to describe objects.

In 2010, an enormous sinkhole (pictured above) suddenly appeared in the middle of a Guatemalan neighborhood and swallowed a three-story building above it. The challenge for the students is to figure out: how much material will need to fill the sinkhole? This challenge revolves around knowing the sinkhole’s dimensions. According to CNN and Slate, the sinkhole has a diameter of 66 feet and depth of 100 feet. The students will use the formula for the volume of a cylinder (pi*radius^2*height) to find the volume of the sinkhole.

The students will have to think about:

-what are they trying to figure out?

-what do they know about the problem?

-what knowledge is needed to solve the problem?

Then there will be the conclusion where the students solve for the volume of the sinkhole.

A.REI Manufacturing Furniture

When most people think of “technology” they think of a device that runs off of batteries or has to be plugged in. This would include computers, calculators or other high-tech tools. In reality technology can be looked at in a much broader way. In this activity the form of technology that will be used is Legos. This activity gives students the opportunities to brainstorm around the idea “what if I had a furniture business?” The students will be able to connect math concepts to real life situations. This real life activity will enhance the student’s way of thinking and learning. The student’s participation will get them to open up their minds and think about how other mathematical concepts can be used in the real world.

This activity aligns with standard CCSS.Math.Content.HSA.REI.D.12: Graph the solutions to a linear inequality in two variables as a half-plane (excluding the boundary in the case of a strict inequality), and graph the solution set to a system of linear inequalities in two variables as the intersection of the corresponding half-planes. The students before this activity have been working with solving and graphing one variable and two variable inequalities. The Legos will help the students reach the standard and make a deeper connection/understanding of the standard. This will happen by having the students being engaged by building the combinations of tables and chairs and recording their results in the table provided on the worksheet. With building the Lego tables and chairs as they go along, it will help them see visually how much of each piece of furniture is being created. After the students find the combination that will give them the maximum profit, they will then look at the constraints they had and create inequalities. With the inequalities they create, the students will then graph the inequalities, shade the appropriate regions and see where the linear inequalities intersect. The students will then compare their calculations from the combinations they created to the linear inequalities graph and make connections on the relationship between the two methods. The students will notice that where the inequalities intersect is where their solution is, that point is the combination of what will maximize their profit.

Central Focus of the lesson:
The students will brainstorm what goes into a furniture company. The students will be asked a series of questions where they will have time to discuss with their group members. The questions will be: What things must a company consider when producing a piece of furniture? What information does the company need to decide how much of each piece of furniture to make? For this activity the students will have to find what pieces of furniture will give them maximum profit for their furniture company. The students will be given Legos and instructions that tell what pieces make up a table and what pieces make up a chair. For example a table consists of two large and two small Lego pieces, while a chair consists of one large and two small Lego pieces. Also, the students are given how much profit will be made off of each piece of furniture. The table will have a profit of $16 and the chair will have a profit of $10. From there the students will find what combination will maximize their profit. The students will then create expressions using inequalities. They will then graph the inequalities and see a relationship between their calculations when computing what combination would maximize their profit to what their graph looks like.


Supporting the Students:

The students will be working in small groups of three of four where they will have discussions about the business. The grouping of the students are based off of a learning styles test taken at the beginning of the year. The students were split up into either social or solitary learners. It is important to split up these opposite learning styles because one side is more independent while the other is dependent on other group members. They were then split up in a way where there would be a variety of learning styles for each group in hopes of them bringing different perspectives. This activity is set up this way for many reasons. One reason is for those students who are more timid will have the opportunity to speak amongst just their group members instead of in front of the whole class. The students will be able to hear each of their group member’s thoughts and ideas. Another reason for this grouping is for the students who do get off task or get distracted easily. With the smaller grouping, those students tend to stay on task longer. These students do exceptionally well when working with manipulatives.

With more activities like these, the students will be more actively involved in their learning. From what I have seen is the students want to solve these kinds of problems because they are discovering the solutions instead of being told how to find the solution.


Lesson Plan Better Math Blog Furniture

Manufacturing Furniture Worksheet