Tessellate and Shout! 8.G.A.2

Tessellate and Shout! 8.G.A.2

by: Christine Godfrey

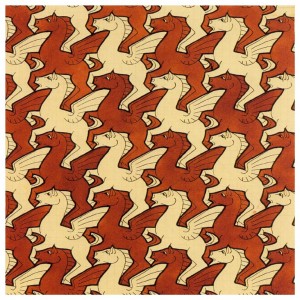
pegasus      3

When I think about integrating lessons for math I always think of the arts because every culture has their own style of art and art is basicly just a bunch of geometric shapes stuck together and perhaps softened around the edges.

So given the 8th grade geometry standard

Math Standard
CCSS.Math.Content.8.G.A.2: Understand that a two-dimensional figure is congruent to another if the second can be obtained from the first by a sequence of rotations, reflections, and translations; given two congruent figures, describe a sequence that exhibits the congruence between them.

And the art standard

Art Standard
GLE: 1.1.7
Applies, analyzes, and creates repetition/pattern, contrast, variety, balance, movement/rhythm, proportion, emphasis/dominance, and harmony/unity in a work of art.
Visual Arts—Principles of Design: Repetition/Pattern, Contrast,
Emphasis/Dominance, Variety, Balance, Movement/Rhythm, Proportion, Harmony/Unity
• Explores and creates patterns, movement, and rhythm by using the repetition of lines, shapes, and colors.

The math problem I think of is creating a tessellation out of regular polygons like with triangles, squares, hexagons or with a rhombus. Culturally tessellations could be used to teach students about the 20th century art culture delving into the life of M.C Escher who popularized this art in the western hemisphere. Tessellation could also be used to teach students about the Roman Empire and the use and spread of aqueducts.

Hunger Probability Games CCSS.Math.Content.7.SP.C.8

Hunger Probability Games CCSS.Math.Content.7.SP.C.8

Megan Kriete, Christine Godfrey, Eric Zils

numbers1-20

Welcome to the Hunger Probability Games! There will be 6 of your students randomly drawn to be picked for the ultimate Mathematics show down. Once your students number is picked that student cannot be drawn again. Let the games begin! Then students will find the probability of their number either drawn or not drawn in the activity. This activity is a lesson for the students to find probabilities of compound events using a program in the TI-84 Graphing calculator and a tree diagram.

This is a statistics and probability activity. The problems in this activity have numbers which do not repeat. This lesson will be the second lesson in a four-lesson unit. Using a procedure to write probability problems containing non repeating numbers. The probability problems are using drawings and/or manipulatives to solve real world problems by using an algorithm or technology. The mathematics content addressed in this learning segment is Common Core State Standard CCSS.Math.Content.7.SP.C.8 Find probabilities of compound events using organized lists, tables, tree diagrams, and simulation. For example, how many ways could the 3 students, Mark (A), Janet (B), and Teri (C), come in 1st, 2nd and 3rd place? Solution: making an organized list will identify that there are 6 ways for the students to win a race {A, B, C} {A, C, B} {B, C, A} {B, A, C} {C, A, B} {C, B, A}.

For the students who are English Language Learners (ELL), they will be allowed notes describing any terms in their native language. For all students the terms and algorithms will be defined/described on the whiteboard so they may construct their own mathematics dictionary. The visually impaired student will be given the definitions/descriptions/notes (algorithms) in large print or in braille through special education services. For students who have demonstrated that they have not yet mastered the sixth grade Common Core State Standard of recognizing statistical questions, displaying data and summarizing data sets they will receive additional help/tutoring outside of class. Students who have difficulty visualizing probabilities abstractly or with the technology will be given manipulatives.

Scaffolding Procedures

  • Students will use previous and current vocabulary and mathematical strategies in this lesson, such as factorial.
  • Students will use technology to gather data in order to fill in the probability table used to record their chances of having their number drawn in the game.
  • Students will then use the data they gathered to draw a diagram representing the data.
  • After “X” amount of time the teacher will show students how to represent the data with a tree diagram.
  • Students will then apply the table and tree diagram for the use of answering the question portion of the activity.
  • As homework students will then use this procedure to create and solve their own probability problem using coin(s).

Attachments: Lesson Plan and Activity Sheet (end of lesson plan): LessonPlan 1 Group.1

Calculator Directions: TI-84 Graphing Calculator


CCSS.Math.Content.8.SP.A.1 Scattered Data

boys-playing-basketball3

Common Core State Standard for this lesson:

CCSS.Math.Content.8.SP.A.1-Construct and interpret scatter plots for bivariate measurement data to investigate patterns of association between two quantities. Describe patterns such as clustering, outliers, positive or negative association, linear association, and nonlinear association.

Instructions for activity:
• Read main question (Central Focus of the activity): How long does it take to pass a ball around in a circle while adding one more person to the circle each time around?
• Make a class prediction for how the data collected will appear.
• Number off students, assign placement of when to join the circle. One student will run stopwatch and record the times in table on worksheet.
• Start the activity with one person and time how long it take to pass the ball, repeat with two students, three student and so on.
• Record number of students and time in seconds
• Organize data in a table with number of students (n) being one variable and time (s) being the other.
• Students do Parts 2 and 3 in their small groups being prepared to discuss answers as a class.
• As a whole class disscuss answers.
Justification for modeling: See Mathematical Practice number 4.

.Tools: Ball, stopwatch, worksheet, paper, and pencil.

Vocabulary: Bivariate, variables, scatter plot, univariate, functions, and first differences.

Mathematical Practices for this lesson:

Practice 1: Make sense of problems and persevere in solving them.
Justification: Students can check that their answers make sense and are able to explain it.
Example: Students discuss Part 3 questions on worksheet in small group.

Practice 2: Reason abstractly and quantitatively.
Justification: Students can find and use the necessary information and are able to break apart a problem.
Example:In worksheet Part 3 questions are answered using the information collected/interpreted from Parts 1 and 2.

Practice 3: Construct viable arguments and critique the reasoning of others.
Justification: Students can use prior learning, make reasonable predictions, and use appropriate definitions and language.
Example: At the beginning of the activity when students are introducted to the activity.

Practice 4: Model with mathematics.
Justification: Students can apply what I know and show it in a mathematical problem, could draw graphs and tables, and reflect and revise on solutions and make changes as needed.
Example: The completing, collection, and using of data from Part 1 and 2 of the worksheet.

Practice 5: Use appropriate tools strategically.
Justification: Students can know the tools that are available and use them appropriately and use tools such as stopwatches and calculators.
Example: Data collection portion of Part 1 and answering of Part 3 question 5-7.

Practice 6: Attend to precision
Justification: Students can provide good explanations that are clear and precise, understand the vocabulary and their definitions, communicate, show their work and check their work.
Example: Completion in small groups of Part 3 of the worksheet and end of class discussion of Part 3 questions and Parts 1 and 2 data.

Practice 7: Look for and make use of structure.
Justification: Students will use patterns or structures to be able to see was to show the same objective or meaning, realize the relationship between the data collected, make predictions, use pictures to show numbers, draw conclusions, use vocabulary and formulas.
Example: Using intro, Part 1, and Part 3 of worksheet.

Practice 8: Look for and express regularity in repeated reasoning.
Justification: Students will explain to a partner how they got their answer.
Example: Part 3 of worksheet and class discussion.

This lesson/activity was a hit with the students, went well with my classroom environment and had minimal misconceptions.

Math 486 Lesson Plan

Scattered Data

Scattered Data Answer Key

Exit Ticket

Posted and Created by: Christine Godfrey, Andrea Hamada, and Megan Kriete.