How Much Rice?! HSF.LE.A.1.C

screen-shot-2016-11-09-at-7-03-55-pm

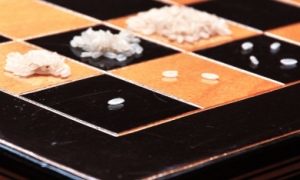
In a small village in China there was a peasant girl who was in the right place, at the right time and she ended up saving the life of the Emperor. The Emperor was so grateful to the girls that he told her she could have any reward she desired. This particular girl also happened to be an excellent chess player and she made the following request.

“I would like you to place one grain of rice on the first square of a chessboard. Two grains of rice on the second square, four on the third square, eight on the fourth square, and so on, until you have covered all 64 squares. Each square should have twice as many grains of rice as the previous square.”

The king thought, no problem, a few grains of rice is no great loss for the kingdom. So he asked the girl, are you sure you don’t want something a little more valuable? But the peasant girl insisted, no this is plenty.

How many grains of rice would the king be giving the peasant girl by the time all the squares are filled?

Can you write an equation to represent this scenario?

CCSS.MATH.CONTENT.HSF.LE.A.1.C
Recognize situations in which a quantity grows or decays by a constant percent rate per unit interval relative to another.

CCSS.MATH.PRACTICE.MP4
Model with mathematics.

This lesson is very engaging because it starts off with a folktale which can grab the student’s attention. This lesson can also be even more engaging by actually bringing in chessboards and rice and have the students model this activity until they get to the point where they realize, they don’t have enough room on the board to fit all of the rice. At this point the students should also be able to recognize that this is representing an exponential function and they can be challenged even further by trying to write a function to represent the scenario.

Hot Wheels and Parabolas – HSF.IF.C.7 and HSF.BF.A.1.A

screen-shot-2016-11-01-at-5-19-48-pmscreen-shot-2016-11-01-at-5-21-27-pm

Students will be working in groups, racing (pushing) Hot Wheels cars of varying sizes up a ramp and letting it fall back to the starting point. When the cars are pushed up a ramp, at some point, they will stop moving forward and begin to roll back to the ground; this relationship between the position of the cart and the time elapsed is representational of the quadratic equation in general form.

In this activity students will be conducting an experiment and collecting data to find what the quadratic equation will be to represent them pushing their car up the ramp and it returning back to the ground.

This activity is aligned with the following Common Core State Standards:

  • MATH.CONTENT.HSF.IF.C.7: Graph functions expressed symbolically and show key features of the graph, by hand in simple cases and using technology for more complicated cases.
  • MATH.CONTENT.HSF.BF.A.1.A: Combine standard function types using arithmetic operations. For example, build a function that models the temperature of a cooling body by adding a constant function to a decaying exponential, and related these functions to a model.

For this activity students will use a Motion Detector to measure the position of the car on the ramp along with the change in time. The students will collect this data and analyze it to look for key locations on the parabolic curve so that they can write an appropriate quadratic equation for their particular car rolling up and down the ramp.

screen-shot-2016-11-01-at-4-31-22-pm


Activity:hot-wheels-and-parabolas

Resources: https://www.vernier.com

Walk the Line HSA.SSE.B3

screen-shot-2016-10-27-at-6-16-42-pm

Fitbits,  step counters, and fitness have been on the rise lately. People want to know how many steps they are taking, how well they are eating, and if they are being healthy. This lesson incorporates technology in a real world scenario. Students are able to display their understanding of writing linear equations from data based on data that they collect themselves. Students will look at the number of steps that they take every day for a week, analyze the data, and write linear equations to match the number of steps that they took each week. They will be utilizing technology such as their smart phones, or fitness bands such as a Fitbit or an Apple watch to collect their data.

Link to lesson: walk-the-line

The Gizmos of Tomorrow -Algebra1.7.A

screen-shot-2016-10-18-at-2-32-28-pm

Gizmos is a interactive math tool for both teachers and students. It provides Common Core State Standard aligned activities, lesson plans, and simulations. Gizmos gives visual representations of concepts that aid students in analyzing data and it provides activity sheets that expands the students’ critical thinking.

the-gizmos-of-tomorrow