![]()

Common Core Standard: HSF-TF.B.5 Choose trigonometric functions to model periodic phenomena with specified amplitude, frequency, and midline.
As current or future educators we have the, often tremendous, task of instructing our students in a way that they actually remember something by the end of the lesson. We not only battle student refusal to learn but now, due to modern technology, we battle for their attention. According to the Statistic Brain Research Institute the average attention span is 8.25 seconds, which most likely is less for high school students. That is three quarters of a second less than a goldfishes’ and with technology like Facebook and Instagram available with a few clicks on our phones, it is of little wonder why there is only a few precious moments to capture attention.
Thus, our lessons must be interesting and engaging. We must develop lessons that will draw the students in and help them make a personal investment to encourage self-driven learning. Therefore, using technology can provide attention grabbing hooks as well as offer personal investment.
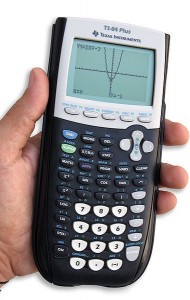
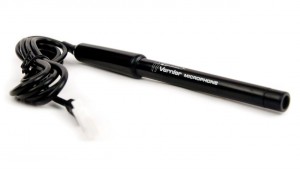 One of the best ways to use technology is to put it into the hands of our students. Attached below is a sample worksheet for a lesson on trigonometric functions. The lesson uses a TI-84 or 83 graphing calculator, tuning forks, free EasyData software for recording the data, and a Vernier microphone for capturing the data. The lessons teachers can teach with these tools vary and can be as simple as model for students to look at or can become a data collecting exploration lesson. The worksheet below is the latter, wanting students to see differences between sound waves looking specifically at amplitude, midline, period, phase shift, and vertical shifts.
Using the instruments students will explore and discover that notes in music, through the pitch of the tuning forks, have specific details and unique qualities. They will start by holding the microphone next to a vibrating tuning fork and then record the graph the calculator provides. The students will record three different graphs of three different tuning forks onto their worksheets, picking the most constant piece of the recorded graph to compensate for the steady decrease of vibrations as the turning fork returns to its restful state.
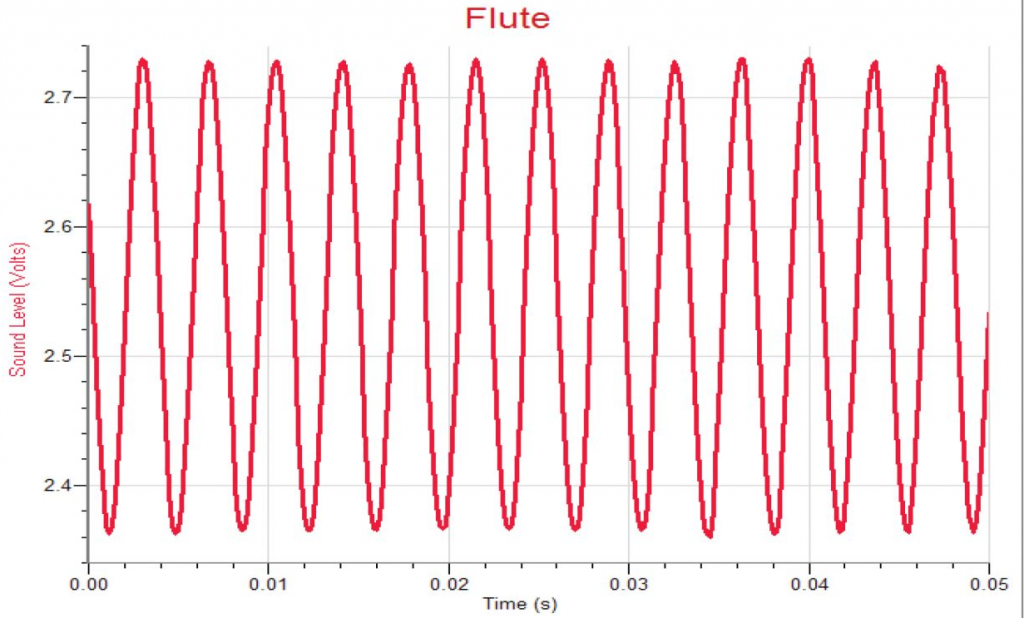
 Once students have gathered their data, they will calculate the above mentioned mathematical goals of amplitude, midline, periods, phase shift, and vertical shifts. To calculate this data, the worksheet uses simple leading questions to help teach what each term means. For example, amplitude will be learned through the question; What is the distance from the midline to the top of the peak? Also, given the above simplified definition of what is the amplitude of tuning fork #1? Using questions like this, teachers can introduce students to the new vocabulary and concept of periodic phenomena in a simple, yet fun way. So explore, get your students involved in their learning and above all help them understand.
Worksheet: Stick a fork in me worksheet