Can You See It : ƚI ɘɘƧ uoY nɒƆ
This learning progression will be taught in a 10th grade High School Geometry classroom and the following three Common Core State Standards will be used as goals: HSG.CO.A.3, HSG.CO.A.4 and HSG.CO.A.5. Additionally, the mathematical practices that align with this learning progression are the following: MP5 Use appropriate tools strategically, MP7 Look for and make use of structure, and MP8 Look for and express regularity in repeated reasoning. The textbook this class uses is CORD Geometry 1 Learning in Context 4th edition. Specifically, I will be using chapter 4 on polynomials and factors.
Students have previously been introduced to patterns and relationships between two things. For example, in previous classes they have discussed series of geometric functions and more recently similarities in triangles. Specifically, students have worked with distances on the coordinate plane is relation to the origin and a point and how this constant equidistance moved around the origin would rotate a point which was a topic discussed in chapter 3. In this learning progression students will be once again looking at these rotations of points with the larger and focused picture of rotations, reflections, and translations of various geometric figures. The first skill and portion of this lesson will be to examine how to manipulate an object/shape on the coordinate plane through reflections that will maintain its original form. The various reflections, which will depend on the geometric object used at the time, will include over the y-axis, x-axis, y=x and y= -x. The students will practice this process with a variety of shapes and discover which shapes can or cannot use one of the above mentioned reflections. For example, a square can be both reflected across the y= x and y= -x, but a rectangle cannot. The second lesson will then discuss rotations of the same geometric objects and once again help students investigate which rotations certain shapes can and cannot rotated x number of degrees. The third lesson in this progression will be to consider translations of objects so as to still maintain shape, size, and angles. The third lesson will also help clarify the previous topics with practice with all of the movements as well as help students understand notation for the actions, like T(2, 3) referring to a translation of all vertices of an object to the right by 2 and vertically by 3.
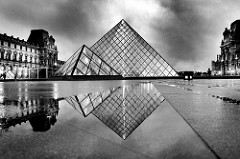
Thus, this learning progressions is all about helping students see both with physical pictures and in their minds eye the mirrors, rotations, and translations found everywhere in mathematics and life. As can bee seen from the pictures above reflections are as common as looking into a pool of water. Therefore, modeling such actions with mathematics can help students understand its importance to our everyday life and aspiring to teach this beautiful concept as a guided lesson and at a pace that will not overwhelm any of our students.
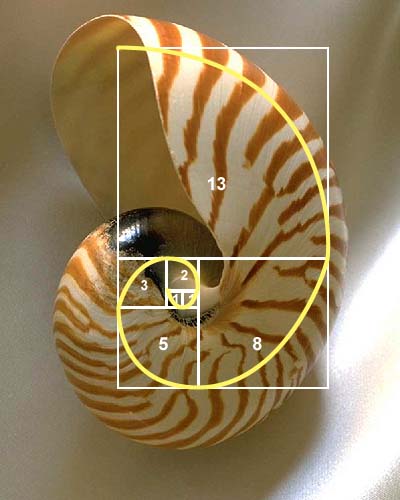
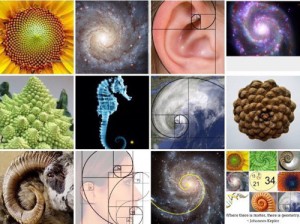
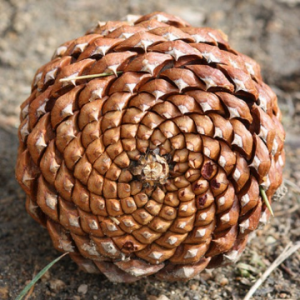
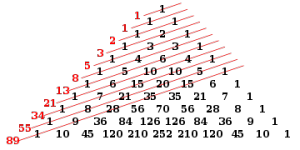 As can be seen from the various picture included in this post, this sequence is everywhere.
 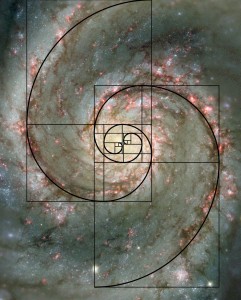 Thus, during your classroom discussion of functions and sequences, bringing in pictures like these will help students not only see that math is all around them, but discover a new way to look at their surroundings.
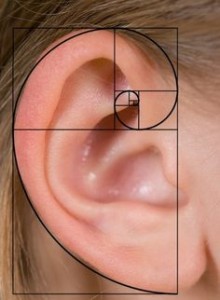

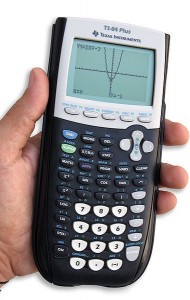
 One of the best ways to use technology is to put it into the hands of our students. Attached below is a sample worksheet for a lesson on trigonometric functions. The lesson uses a TI-84 or 83 graphing calculator, tuning forks, free EasyData software for recording the data, and a Vernier microphone for capturing the data. The lessons teachers can teach with these tools vary and can be as simple as model for students to look at or can become a data collecting exploration lesson. The worksheet below is the latter, wanting students to see differences between sound waves looking specifically at amplitude, midline, period, phase shift, and vertical shifts.
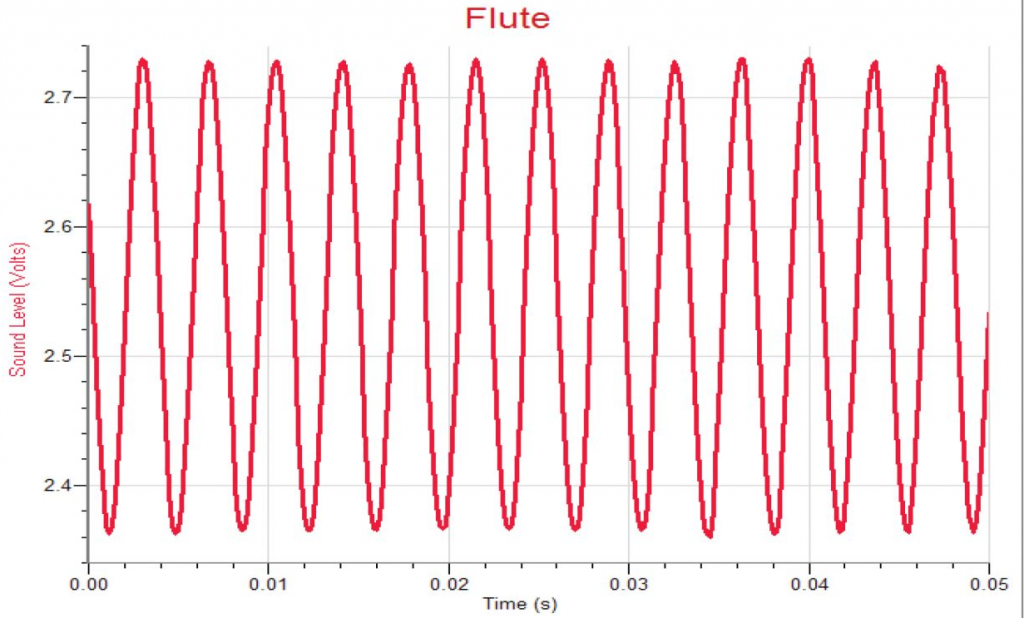
 Once students have gathered their data, they will calculate the above mentioned mathematical goals of amplitude, midline, periods, phase shift, and vertical shifts. To calculate this data, the worksheet uses simple leading questions to help teach what each term means. For example, amplitude will be learned through the question; What is the distance from the midline to the top of the peak? Also, given the above simplified definition of what is the amplitude of tuning fork #1? Using questions like this, teachers can introduce students to the new vocabulary and concept of periodic phenomena in a simple, yet fun way. So explore, get your students involved in their learning and above all help them understand.
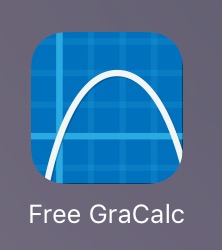
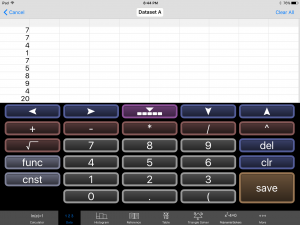
 Pushing this opens a new menu that has more options in the upper right hand corner called Mode, and just wait there’s more. If you push the Mode button it opens? Yep, you guessed it, another menu with more feature!
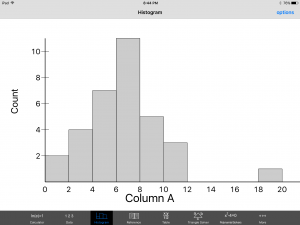
 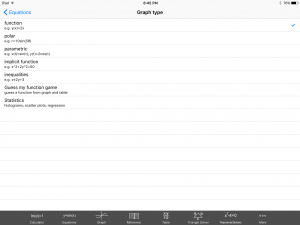 This time click the Statistics option and hear that ‘click’ sound play your favorite tune. ‘Click.’ Now don’t go away, if you place your order today we will throw in, for absolutely free, that’s right, absolutely free data set entry into a spread sheet. Just enter your data set. Then here comes my favorite part, are your ready? Click the Histogram button at the bottom of the screen and ‘presto’, your histogram has been summoned. Turn every student in your class into a Mathamagician. That’s right! A Mathamagicaian, and bring your lessons to life. And if you order your copy of GraCalc between now and Armageddon, I’ll cut the cost in HALF. That’s right, In half. Not good enough, you say? Well finish reading this blog and I let you have the app for my famous low, low, super duper, can’t get a better deal anywhere price of… are your ready? FREE, Yes I said it, Freeeeeeeeeeeeeeeeeeeeeeee.