Infomercial voice:
Have ever wished your students would jump up from their seats after accomplishing a task and say, “I am a genius?” Have you ever thought while teaching a student, “how can I get him to to understand? I have tried everything.” Well then. I have something for you, but first ask yourself, “what can I do to make my lessons more appealing?” Well ask and you shall receive. Introducing, GraCalc. It is an innovating and captivating calculator. How boring, you say? No Sir. This calculator is packed full of exciting ways to crank out some awesome computation. Not only does its function keys feel glassy and seamless, but you can even turn on clicking noises. ‘Click.’ ‘Click.’ ‘Click.’ This application will not leave you disappointed because with every feature comes more features! Like the Equations button.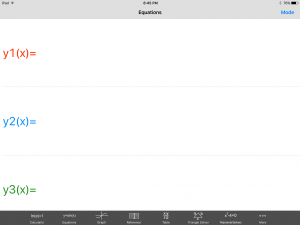 Pushing this opens a new menu that has more options in the upper right hand corner called Mode, and just wait there’s more. If you push the Mode button it opens? Yep, you guessed it, another menu with more feature!
 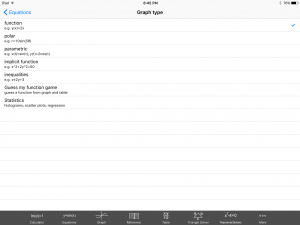 This time click the Statistics option and hear that ‘click’ sound play your favorite tune. ‘Click.’ Now don’t go away, if you place your order today we will throw in, for absolutely free, that’s right, absolutely free data set entry into a spread sheet. Just enter your data set. Then here comes my favorite part, are your ready? Click the Histogram button at the bottom of the screen and ‘presto’, your histogram has been summoned. Turn every student in your class into a Mathamagician. That’s right! A Mathamagicaian, and bring your lessons to life. And if you order your copy of GraCalc between now and Armageddon, I’ll cut the cost in HALF. That’s right, In half. Not good enough, you say? Well finish reading this blog and I let you have the app for my famous low, low, super duper, can’t get a better deal anywhere price of… are your ready? FREE, Yes I said it, Freeeeeeeeeeeeeeeeeeeeeeee.
Obviously, if your still reading this blog I caught some kind of interest in you. This application that is officially called ‘Free GraCalc’ is created by William Jockusch and has many useful features. However, for the purpose of this blog I choose to talk about the statistics side of the application. Particularly, if you want to help your students understand that any data set can be put into a histogram that then can be used to interpret the data. For example, I entered a few low random numbers into the spread sheet and had the application build me a histogram. 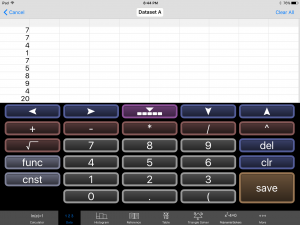
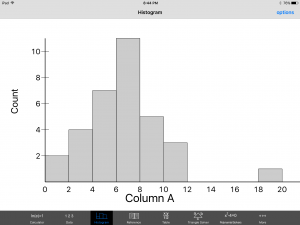
From this histogram we can make a few conclusions, one being that the entry at 20 most likely is an outlier because it is fairly far from the rest of the data. Simply put, this application puts powerful tools into the hands of your students and can truly bring your mathematics to life. It is a free application on the iPhone as well as on the iPad. I included with this post a full lesson plan to help show how a teacher could include this application as both a learning exercise on what histograms are and the information we can gather from them. Also included in my lesson plan through the class activity will be a quick easy to follow application tutorial to help introduce the students to one of the many feature this powerful app has to offer. So go fourth and teach with style. Turn every one of your students into Mathamagicians!
Common Core Standard used in lesson plan with technology in mind:
CCSS.MATH.CONTENT.HSS.ID.A.1
Represent data with plots on the real number line (dot plots, histograms, and box plots).
Lesson Plan: