Amusement Park 7.G.B

During this lesson, students will  be put to the test, using their prior knowledge from the previous geometry unit on two- and three-dimensional shapes involving area and perimeter.

You and your team have just been hired by Walt Disney Parks and Resorts Worldwide to landscape a brand new amusement park with rides. WDPR has provided you with a blank map with letters E through M, representing the nine rides that you must include in your design. Your task is to map out the most effective design in order to maximize the number of visitors to each ride. Your job is to gather all of the information you can, map out each ride using GeoGebra to graph your park, and present a justification as to why your design will maximize visitors to each of your rides.

In order to complete this lesson, students will be split into groups of 3-5. The class as a whole will have a set number of rides they must include in their park, and a set area for the park itself, but each group will devise different ride sizes and configurations throughout the map in order to maximize visitors to each ride.


Modeling Lesson-1xyl8m6

Gold Medal Problem 6.RP.A.3.C, MP3, MP6

Gold Medal Problem

By: Natasha Smith

BRONZE, SILVER, and GOLD… what place will you get?

As you can tell from the above picture, the U.S. takes home the gold when it comes to the Olympics. But have you ever wondered why they are able to take home so many medals?

In this lesson, students will discuss what effects how many medals a country receives at the Olympics. They will use data for the 2016 Olympics and calculate the percentage of medals each country received. Students will then compare and discuss the relationship between the percentage of medals each country received and its population and national wealth.

This lesson integrates Social Studies as students are looking at countries from all over the world and discussing how their different circumstances may affect their ability to receive Olympic medals. This lesson is culturally responsive as students will be critically thinking about how different countries may have advantages to winning Olympic medals and students may begin to realize that where you are from has a huge impact on your ability to medal. This lesson will also peak students interest as many of them follow the Olympics and idolize the athletes.

Extention: After comparing the data as a class, students will try and determine other factors that may have an impact on a country’s medal count. They will research and find their own data and decide whether or not they think the factor contributes to the amount of Olympic medals a country receives.

Math Standards:

CCSS.MATH.CONTENT.6.RP.A.3.C

CCSS.MATH.PRACTICE.MP3

CCSS.MATH.PRACTICE.MP6

Possible Social Studies Standard:

G.L.E.5.4.1: Analyzes multiple factors, compares two groups, generalizes, and connects past to present to formulate a thesis in a paper or presentation.

SaveSave

SaveSave

SaveSaveSaveSave

SaveSave

SaveSave

SaveSave

SaveSave

Classroom Geometry 6.G.A.1

Math Standard:

CCSS.Math.6.G.A.1- Find the area of right triangles, other triangles, special quadrilaterals, and polygons by composing into rectangles or decomposing into triangles and other shapes; apply these techniques in the context of solving real-world and mathematical problems.

Math Problem:

With this picture and standard I would have a worksheet for my students with a story on it. The story would include hints on things they would have to find in the classroom and solve the problem the story is asking. For example the students might have to find a right triangle in the classroom and figure out the two side lengths and then solve for the hypotenuse. I would have the students work together in teams to solve the different problems I would have set up around the room. Doing this shows the students how they use geometry in the real world. For example finding measures of the walls and solving for the area in a room. In real life you will need to know measurements of rooms when decorating, painting, building, etc. I also could have students use their tablets and the resources they have on them to solve the problems. Students can look up their own pictures and try and solve the angle measures in the pictures or they can use a tool to make shapes and solve for those shapes.

Language Arts Standard:

CCSS.LanguageArts.L.6.1- Demonstrate command of the conventions of standard English grammar and usage when writing or speaking.

Language Arts Problem:

I would incorporate this standard into this lesson because when talking in small groups and as a class I want my students to be speaking with the correct vocabulary from the lesson and use appropriate grammar. I would also have my students write a brief paragraph at the end of the lesson to see how they think they can use this in the real world. Having the students think of ways they can use it in everyday life shows the students that the lesson is not “pointless” and that “they will never use this again”.

How this lesson teaches culturally:

This lesson teaches culturally because the students will be using the tools that they learned to come together as a team or partnership to find thing around the room to solve. This is something that everyone can do at home or in the classroom. This also teaches culturally because I used student voice when I asked my students to write down how they would use this in the real world. Having students give their input and how they can use it in their life covers all areas of different cultures and lifestyles. The students are connecting it to their own life.

Changing Serving Sizes 5.NF.6

Dessert is always something that people crave to have. Why not incorporate favorite desserts into math class!

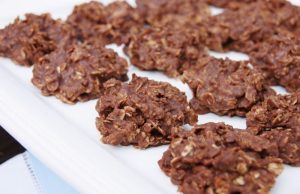
For this activity, students will have to change serving sizes of dessert recipes so that everyone in their class gets a piece. Show the pictures of delicious treats and discuss that the recipes for these sweets only have a serving size of 4 which is a bummer since there are 24 students in the class. Discuss with the class what they need to do in order to make sure there is enough of the treat for everyone in the class to eat or bring home.

Provide multiple recipes with a serving size of 4 so that students have the options of choosing (recipes in link below). Once students get into groups they must use multiplication of fractions to figure out how much of each ingredient is needed to make a serving size of 24 for their recipe. Once the new recipes with the proper serving size is created, the students will create a poster with how they solved the problem and the amounts of each ingredient that is needed. Students will present their recipes to the class. Once the class has agreed that all calculations are correct and the ingredient amounts will create the proper serving size, the class can make these desserts (must be no bake recipes).

Since students can still complete the task without converting into different units, I will not give the conversion chart to all students, to reduce confusion since we have not gone over it before. If students ask about converting, I will provide it to those students who ask for it to add a challenge.

This activity could be used culturally by using recipes from different cultures. Students from the class could bring in family recipes that are from a different culture. This opens up conversation about different cultures and allows students to share their backgrounds.

CCSS.MATH.CONTENT.5.NF6- Solve real world problems involving multiplication of fractions and mixed fractions, by using visual fraction models or equations to represent the problem.

CCSS.Math.Practice.MP6- Attend to precision by having students calculate multiplication problems using fractions accurately and effectively expressing numerical answers with a degree of precision appropriate for each problem in context to the real-world problem.

CCSS.Math.Practice.MP1- Make sense of problems and persevere in solving them by checking their answers to problems using different methods and asking themselves “does this make sense?”

Recipe Options-2o1lm1c


Paper Bridges CCSS 8.EE.B.5 MP 4

Paper Bridges

Standard: CCSS 8.EE.B.5 MP 4

By: Naomi Johnson, Rachel Van Kopp, Tracy Van Lone, Natasha Smith, and Kimberly Younger

Problem

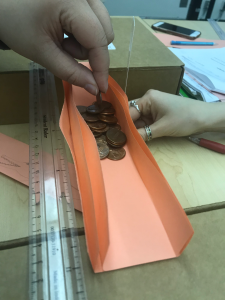
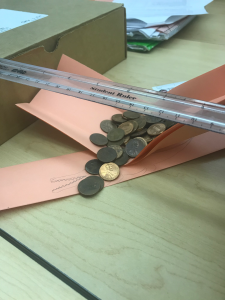
Paper Bridges is looking at the correlation between the number of pennies that a number of paper bridges could hold. To find this, we folded pieces of paper that were all the same size in the same way. We then put one paper, folded as a bridge, on two equal size books, an inch of paper was on each book. We then placed pennies on the bridge until it caved in 1/8 of an inch or collapsed, whichever came first. We then counted the pennies and recorded the number.

We repeated these steps with 2, 3, 4, and 5 paper bridges laying on top of each other to see how more paper effected the number of pennies that were able to be help.
Analysis

Table 1: Data collected from our experiment.

To analyze our data, we inputted the data from Table 1 into our calculators. We performed a linear regression on the data as well as an exponential regression. We were given the following equations:

Linear Equation: y = 12x – 2.2

Exponential Equation: y = 5.9259 * 1.6537^x

We plotted all our data and graphed our equations. Figure 1 shows what this looked like.

Figure 1: Our data plotted with our two equations. The red line represents the linear equation and the blue line represents the exponential equation.
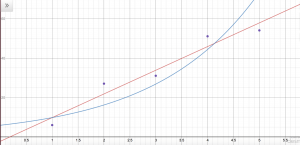
After looking over Figure 1, we had a hard time determining which equation did a better job of representing our data. Neither line was incredibly close or far away from the points. At this point in time, we believed both equations could possibly be good representations of the data.

We decided to find the absolute value of the difference between each data point and their expected linear and exponential value. We then averaged the differences. Table 2 shows what we found.

Table 2: The absolute value of the difference between each data point and their expected linear and exponential value. In the bottom line is the average of the differences.
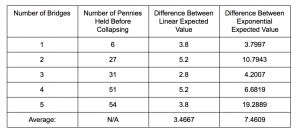
We were than able to see that the linear equation seemed to better match our data. All the linear differences compared to the exponential differences were smaller expect for with the first data point. The average exponential difference was more than two times the average linear difference. It appeared that the exponential equation could be growing too fast.

While we may have found reason to believe the linear equation was the better fit, we still felt like we needed more data. When doing this activity in a classroom, we would recommend extending the domain and creating more data points. We would also recommend having students do multiple trials of the experiment or having students share their data with the class.

Extension

A lot of variables come into play when a structure collapses. For instance, our paper bridges collapse as more and more pennies are placed in the middle. Interestingly, even though all groups of students involved in the investigation in our class used the same paper, folded the same way, and collapsed their bridges with pennies weighing exactly the same amount, no two teams’ bridges collapsed under the same number of pennies. Some teams gently “placed” their coins on their bridges, enabling their bridge to hold more weight than the teams that “dropped” their coins on the bridges. Some teams spread their coins a bit wider along the center of their bridge than others, enabling more coins to stack up on their bridge prior to its collapse. Other teams folded their bridge papers more sharply and precisely, causing the structure to be more rigid. Many variables add up to change the dynamics from one bridge to another despite seemingly identical bridge designs and project execution instructions.
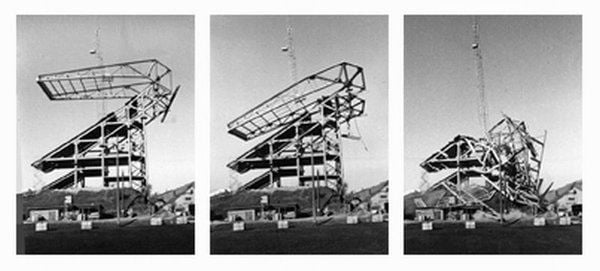
A real-life structural collapse occurred on 1987 when UW built an addition to Husky Stadium. Nine temporary guy wires were holding the stadium roof up while additional structure was built underneath. The stadium was well designed and should not have collapsed. But a collection of variables added up to change the dynamics from the stadium addition as designed to the stadium addition as executed. Construction specifications were not very specific about when the appropriate time would be to remove the temporary guy wires and how many should be removed at a time. Ask students to read these articles and identify the variables they see impacting the collapse. Would the structure have stood if only 5 guy wires had been cut? What if only 4 guy wires were cut and the hollow steel tubular beams had been filled with concrete as specified by the designer? Would the stadium have stood? What about the cat?

Husky Stadium history

Husky Stadium Failures


SaveSave

SaveSave

SaveSave

SaveSave

SaveSave

SaveSaveSaveSave
Inequalities with Kahoot

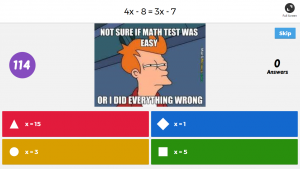
In this lesson, using Kahoot will be a great way to get instant feedback of the conceptual understanding the students have regarding inequalities. Kahoot also allows for students to get instant feedback so they will be able to see instantly if what they did was correct or not. Using Kahoot will be a fun and engaging activity for your students because of the use of technology and because the students will be able to compete against each other for speed and correctness.

CCSS-Math-HAS-REI.B.3:

Reasoning with equations and inequalities.

-Solve linear equations and inequalities in one variable, including equations with coefficients represented by letters

Inequalities with Kahoot

Race Graph: 8.F.A.3, SSE.A.1.A, and SSE.B.3

This learning progression was designed primarily for a bilingual slower pace 9th -12th-grade Algebra 1 course. This class consists of twenty students of who ten do not speak any English and need assistance in Spanish. Throughout this unit, the lessons were provided in 50% Spanish and 50% English as well as all handouts having written directions in both languages. Aside from this class being slow paced because of the language barrier for some students there is also students who struggle in understanding. Overall, this course consists of about 50% not being able to graduate on time as the class is made up of eleven ninth-graders, four tenth-graders, three eleventh-graders and two twelfth-graders. About 50% of the students in this course are anticipated not to graduate on time as their lack of understanding affects more than this course.
The Common Core State Standards that will be satisfied are from three different domains. The first one comes from the cluster titles, “Define, evaluate, and compare functions” and is 8. S.A.3. The second one is SSE.A.1. A and comes from cluster “Interpret the structure of expressions.” The third standard is SSE.B.3 coming from cluster “Write expressions in equivalent forms to solve problems.” In this course, students focus on mastering 8th grade standards as they slowly incorporate high school content standards. Throughout this learning progression, students will focus on four mathematical practices which are MP1, MP4, MP5, and MP6.

The central focus of this learning segment is for students to be able to analyze how the equation and the graph of a line are related. Students will represent a linear relationship as points on a coordinate plane and as an equation representing a line. Students will work towards this by learning how to solve a linear equation for y leading to them discovering slope-intercept form. In this form students, will identify the slope and y-intercept of a linear equation as well as on a graph. Once being able to identify the two pieces of information be able to quickly graph lines. As well as deepen their understanding of slope of a line by being able to explain how changes in the slope affect the steepness and direction of a line. The purpose of students being able to master these skills
is to deepen their understanding of graphing linear equations by providing a quicker method to graphing. Students will understand that making a T-chart or finding x and y-intercept can be time-consuming while using the slope-intercept form is more efficient. All this building their mathematical reasoning for the second unit which is the second half of the chapter which will focus on students exploring data to determine whether a linear relationship exists. They will be able to determine functions and work with modeling direct variation and find the slope and rate of change.

Full learning progression: edtpa Learning Progression

Lesson Plan: Algebra 1 EDTPA lesson plan

HSN.CN.A.1: Perform Arithmetic Operations with Complex Numbers

Image result for complex numbers


Addressed CCSS for Mathematics:

CCSS.MATH.CONTENT.HSN.CN.A.1
Know there is a complex number i such that i2 = -1, and every complex number has the form a + bi with a and b real.

CCSS.MATH.CONTENT.HSN.CN.A.2
Use the relation i2 = -1 and the commutative, associative, and distributive properties to add, subtract, and multiply complex numbers.

CCSS.MATH.CONTENT.HSN.CN.A.3
(+) Find the conjugate of a complex number; use conjugates to find moduli and quotients of complex numbers.

Addressed Mathematical Practices:

CCSS.MATH.PRACTICE.MP2 Reason abstractly and quantitatively.

CCSS.MATH.PRACTICE.MP3 Construct viable arguments and critique the reasoning of others.

Learning Progression Overview:

The lesson will open up with a brief recap to refresh the students on the prerequisite knowledge that is required. After this, the instructor is to present the concept of an imaginary number. The presentation follows the same format as described in the textbook, “Algebra 2”. To put imaginary numbers into context, the instructor will provide a quadratic equation, such that an imaginary number is produced, for the students to solve. Upon deriving the complex number, the instructor will introduce the properties of the imaginary number, i and complex numbers. The students will then transition into their first entry task of performing operations in complex numbers, beginning with addition and subtraction. Succeeding this, the students will learn proceed to their second entry task of multiplying complex numbers, employing their knowledge of the distributive property.  The third entry task will center on the utilization of the conjugate to simplify instances of a number being divided by a complex number. Throughout, the instructor is to prompt the class with short “checks” in the form of verbal questions to assess the progress of the class. Finally, the students will be administered an assessment to gauge their overall mastery of the material. The learning progression can viewed at the link below.

Complex Numbers Learning Progression

Calculating Cost of Wheels HSG.GMD.A.3

roadroller

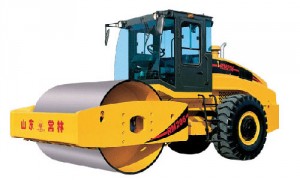
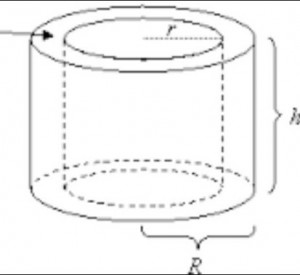
A construction company is designing new road rollers. The wheels of each road roller are made out of steel. The wheels are designed in a cylindrical shape in addition to having a smaller cylinder cut out of the center for the axel to fit through as shown in the picture below. The radius of the larger cylinder measures 2 ft., the radius of the cut-out cylinder measures 0.5 ft., and the length of the wheel measures 6 ft. From the diagram, this would mean R = 2 ft., r = 0.5 ft., and h= 6 ft. If the cost of steel is $2.40 per cubic foot, what is the cost of the steel to construct one wheel? Show your calculations and round your answer to two decimals.

cylinder

To view an assessment commentary and solution, follow the link below.

math-325-assessment-item-blog