Above is a link to a lesson plan I created revolving around the use of modeling and technology. The technology uses are stop watches and video recorders. The main technology focus is the use of the video recorders where students will use them to document their work. Students will create models during the activity which will represent the data collected from their experiments of dropping bouncy balls and calculating time between two bounces and the max height in between those two bounces. If stop watches are not available then you can measure the distance between the two bounces instead.
Uncategorized
CCSS.Math Makes Cents?
One thing that is important to remember when working with mathematics is that it, in fact, does relate to real life. An extremely drastic example would be the show Numbers; an FBI agent’s little brother is a professor of mathematics of a local university and uses his knowledge of probability, statistics, physics, etc. to help catch ‘the bad guys’. Like I said, although this is a very drastic scenario it really does help one see that math can actually be used in everyday life. Another thing to remember, especially when working with middle school and high school students is to remind them that math is really figuring out relationships between elements; how fast you go in a car and the time it takes you to break, the more interest that is charged to a credit card and the minimum payment that you might have to pay, investments, etc. Teenagers and adolescents hardest concept to come by while struggling through their math classes is that they don’t think that math is applied to them directly and they don’t see the relationships within math itself.
One of the Common Core State Standard sections for mathematics is all about modeling. Modeling means to create a picture, or graph, that represents a function, or relationship, to better understand what the overall effect is. We do this with exponential growth and decay, with parabolic functions showing the movement of something being throw into the air, with investments of businesses and companies, even with the world population. This modeling standard is stated, by the CCSS.Math website, “Modeling is best interpreted not as a collection of isolated topics but rather in relation to other standards. Making mathematical models is a Standard for Mathematical Practice, and specific modeling standards appear throughout the high school standards indicated by a star symbol (*).” Other CCSS for Math that is included are:
CCSS.MATH.CONTENT.HSF.BF.A.1.B
Combine standard function types using arithmetic operations. For example, build a function that models the temperature of a cooling body by adding a constant function to a decaying exponential, and relate these functions to the model.
CCSS.MATH.CONTENT.HSF.BF.A.1.C
(+) Compose functions. For example, if T(y) is the temperature in the atmosphere as a function of height, and h(t) is the height of a weather balloon as a function of time, then T(h(t)) is the temperature at the location of the weather balloon as a function of time.
CCSS.MATH.CONTENT.HSF.LE.A.2
Construct linear and exponential functions, including arithmetic and geometric sequences, given a graph, a description of a relationship, or two input-output pairs (include reading these from a table).
An experiment called ‘Making Cents of Math’ will be how we will tie everything together with a pretty mathematical bow. This experiment uses a Vernier sensor called ‘Dual-Range Force Sensor’. This sensor is used to measure pulling and pushing forces. It could be used to help study the impact of car crashes and it could also be used to study trucks and the amount of force that they are able to pull and it could lead to some findings on how to increase the strength of the truck in order to pull more weight. However, today we will be using it to create a relationship between the amount of pennies and how much they weigh. The sensor looks as such:
The cord you see here will plug into a laptop and it will record the data for you. Instead of the metal mass attached to the hook on the picture on the left we are going to hand a paper cup from the hook. This is going to be how we will measure the weight of all of the pennies. Using the Dual-Range Force Sensor and the appropriate software on the laptop we will be able to create an accurate table, which will then give us our coordinate points that we will graph on a graphing sheet of paper.
Starting out, each group of mathematicians will receive 32 pennies (4 sets of 8 pennies). After their paper cup is properly hanging of the sensor’s hook each group will slowly measure the first set of 8 pennies, only recording the weight after the cup has stopped swaying. This will ensure a more accurate weight. Each group will continually add the second, third, and fourth set of pennies and recording the resulting weight. Now, they can’t have the computer record everything for them! They will have to find the slope of the line that these data points created. They’ll have to use two sets of data points and the slope formula, , and write a complete linear function in the form of , where m is the slope and b is the y-intercept. Also, to assist them in their progress throughout this experiment, they will have to work through the handout which can be found here: https://www.vernier.com/files/sample_labs/RWV-02-DQ-making_cents_of_math.pdf. This will allow them to see the relationship between the pennies and the weight (as well as the picture that they’ll have to create) and it will also allow them to pick apart the experiement and each peice of the equation and determine why each part is important.
This is just a very small experiment, however it teaches the students how they might be able to find a relationship between two different elements and how they can apply math directly to a real life scenario. This is especially important for those students who struggle in realizing that math is important in the everyday life and can be used in the everyday life and that it’s not just something that they’re forced to take for a minimum of 2 years in high school.
Exploration of the Euler Line using Geogebra- HSG.CO.D.12

This lesson focuses on the use of modeling in Geogebra to help students explore the concept of the Classical Triangle Centers (centroid, orthocenter, and circumcenter) and how they relate to the Euler Line. In the activity for this lesson, students will be asked to make constructions of triangles using Geogebra, and manipulate the vertices of the triangles to answer a series of questions relating to the centroid, orthocenter, and circumcenter. They will also be asked questions that will help them to further explore the relationship between these three centers of a triangle.
Lesson and Activity Link: euler-line-modeling-lesson-plan
Modeling Systems of Equations fun with GeoGebra: HSA.CED.A.1
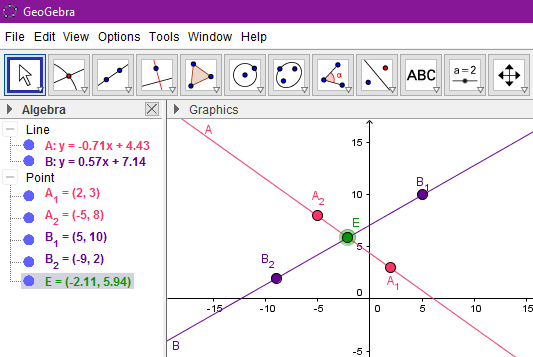
GeoGebra is dynamic mathematics software for schools that joins geometry, algebra, and calculus. This software is a fantastic tool for students of all ages. For this lesson plan, I incorporated the topic of solving linear systems of equations using the benefits of having GeoGebra. I had students work through the process of graphing the systems of equations by hand but had them use the tool to check their work for them to have instant feedback. This allowed students to check their models and provided them with an instant model of what their systems should look when graphed. I also included a challenging problem where the students worked with a system that included a quadratic equation. This was something for the students to think about since we had only been working on linear equations. Using GeoGebra provided a great model representation of this particular system and allowed the students to see that a system could include more than linear equations. Throughout this activity I also had students work on creating their equations given points to work from to allow for deeper thinking.
Crow in the Pitcher 8.F.B.4
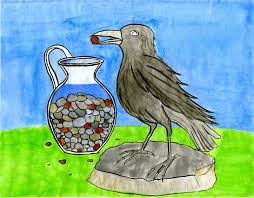
This is an 8th grade modeling lesson. In this lesson students will be learning about the linear relationship between two quantities and then analyzing the results on a graph. How many marbles will it take for the water to rise from 80 liters to 100 liters? In this activity students will be placing marbles into cylinder that is filled with water to see how many marbles it needs for the water can rise.
HSF.BF.A1, HSF.BF.B3, HSF.LE.A2 – Building and Interpreting Exponential Functions
The attached learning progression details a 3 day excursion through the finer points of building and interpreting exponential functions. Students will gain experience working with exponential functions and using the basic procedures to solve story problems. The first day details the steps to solving a word problem using exponential growth and decay, including compounded interest. The next day introduces story problems with logarithms and the number e. The third day ties the other two together in the form of a review game where students can answer questions to gain points and, ultimately, win the activity.
The following Common Core standards are addressed:
HSF.BF.A.1: Write a function that describes a relationship between two quantities.*
HSF.BF.B.3: Identify the effect on the graph of replacing f(x) by f(x) + k, k f(x), f(kx), and f(x + k) for specific values of k (both positive and negative); find the value of k given the graphs. Experiment with cases and illustrate an explanation of the effects on the graph using technology. Include recognizing even and odd functions from their graphs and algebraic expressions for them.
HSF.LE.A.2: Construct linear and exponential functions, including arithmetic and geometric sequences, given a graph, a description of a relationship, or two input-output pairs (include reading these from a table).
Building and Interpreting Exponential Functions, a learning progression
HSG.CO.A.3, HSG.CO.A.4, HSG.CO.A.5 – Translations, Reflections, and Rotation Learning Progression
This learning progression will be taught in a high school sophomore geometry classroom. Prior to this learning progression, students will have been introduced to basic geometric shapes. Students will be familiar with much of the vocabulary surrounding this lesson. They will know the definitions of each of the following terms: line, line segment, ray, quadrant, angle, etc. This particular learning segment will introduce students to rigid transformations within the plane. This learning progression will begin be students learning the concepts and procedures necessary to complete each of the rigid transformations: translations, reflections, and rotations. Following each of these lessons, students will learn how to combine transformations and whether or not the order of transformations matters. The final lesson of the progression will assess whether or not students can perform compositional transformations on a figure. The order of the progression will allow students to build on their knowledge of geometric vocabulary and previous lessons. This progression will provide students with new conceptual understanding and will prepare them for future learning segments.
This learning segment will adhere to the following common core cluster:
CCSS.MATH.CONTENT.HSG.CO.A.3
Given a rectangle, parallelogram, trapezoid, or regular polygon, describe the rotations and reflections that carry it onto itself.
CCSS.MATH.CONTENT.HSG.CO.A.4
Develop definitions of rotations, reflections, and translations in terms of angles, circles, perpendicular lines, parallel lines, and line segments.
CCSS.MATH.CONTENT.
Given a geometric figure and a rotation, reflection, or translation, draw the transformed figure using, e.g., graph paper, tracing paper, or geometry software. Specify a sequence of transformations that will carry a given figure onto another
Modeling a Digital and Global Age Learning Environment
Modeling a Digital and Global age Learning Environment
Brittany Moore
Bolded words are linked to sites!
Technology is even more present in our world than ever, and a very large part of our students’ daily lives and in how they see and interpret the world around them, so it only makes sense that it is incorporated into their standard learning regimen.
Web 2.0 refers to the new stage in development in the World Wide Web that allows users to interact with webpages rather than just use them as a source of information. This is a wonderful opportunity for teachers and should be taken advantage of.
There are many new ways for teachers to connect and share ideas, which they can use to create new lessons and gain new teaching strategies or to find ideas to supplement their already tried and true methods. Teachers may also find this helpful to help students who are struggling and not grasping the concept the way the teacher is teaching it. Many teachers think of Pinterest ![]() when they think of turning to the internet to find creative lesson ideas, but would you have thought to look at Scholastic for interactive math lesson ideas? They even have some awesome tips for integrating technology into your classroom.
when they think of turning to the internet to find creative lesson ideas, but would you have thought to look at Scholastic for interactive math lesson ideas? They even have some awesome tips for integrating technology into your classroom.
You have used technology find ways to enhance your lesson, now how can you present this information to your students in a way that uses the technology to make it fun and interesting? Rather than standing at the front of the room lecturing, one go to form of presentation is the Prezi, an interactive slideshow presentation that is customizable to your presentation. Now, a slideshow presentation may seem like a difficult or dull way to learn math, but this Prezi about the number system provides an amazing visual for students.
https://prezi.com/n-8ibkiw881r/number-systems/
Prezi can be accessed for free, but creating a free presentation allows Prezi to add it to their database for other users to search and view or use, which can also be a helpful way for teachers to find new ideas or ways to present topics. This could be an example to students about how to be responsible about what they post because once it’s online it stays online forever, and also to discussions about plagiarism the consequences of taking someone else’s work to pass it as your own.
Other sites that can be extremely helpful, Desmos Graphing Calculator is not only an extremely useful resource for students, it also has pre-programmed examples under the tab on the left side and allows sliders to be able to plug in variables into generalized formulas.
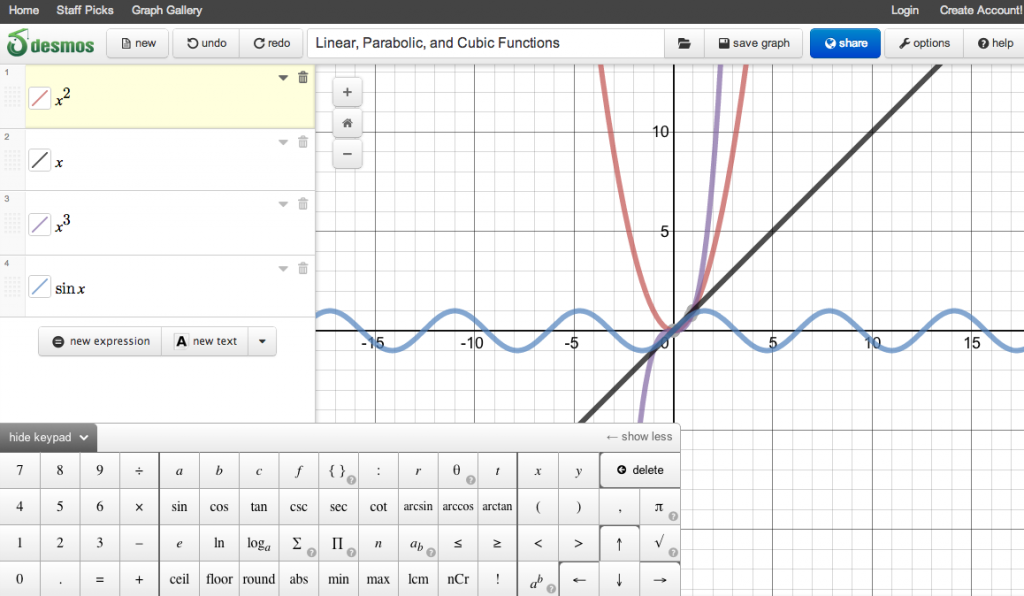
This could be used as a modeling exercise during instruction. A teacher could even project the graph or lines up onto the whiteboard and mark points or lines on the perfectly projected graph rather than having to draw the axis and try to guess while plotting points, this will make it easier for students to see exactly where points are. This is also a helpful resource for students when they are at home they can access the examples. Desmos is also available as an app on all devices and could be used as a support or accommodation for students who may have difficulties with fine motor function and are unable to graph on paper.
One way that utilizes technology and makes assessment fun for students is Kahoot!, a survey type quiz program that allows students to use their phones or computers to answer questions projected onto the board. Students receive points for their answers correctness and then the speed of their answer. This can be a fun formative assessment as well self assessment for teachers and students to gauge the students’ understanding of the topic and determine what materials need more focus or review.
Algebra 1: Exploring Linear Functions Understanding Slope and Intercepts

This learning Progression is based the Agile Mind Curriculum. During the introduction of functions students will plot the points from the table and determine how linear functions work and look like. By graphing and analyzing, students will begin to understand linear equations. Students will begin by understanding rate of change and slope whether the line is parallel and perpendicular. The equation slope will be learned and shown in different manners. Students will not be required to learn formulas, but build comprehensive understanding that help them understand and find key components of a linear equation/function.
The entry task for the beginning of the learning progression has students analyze the angles of perpendicular lines.
Opener
Students will be asked to use a protractor to measure the angle of the given lines. Students then will be able to determine that the angle is 90 degrees therefore emphasizing the concept of perpendicular lines (Fig. 1). They will understand that perpendicular lines make a right angle. Students will then be asked to describe the relationship between the given two lines using the following vocabulary: right angle, intersection, lines, and perpendicular.

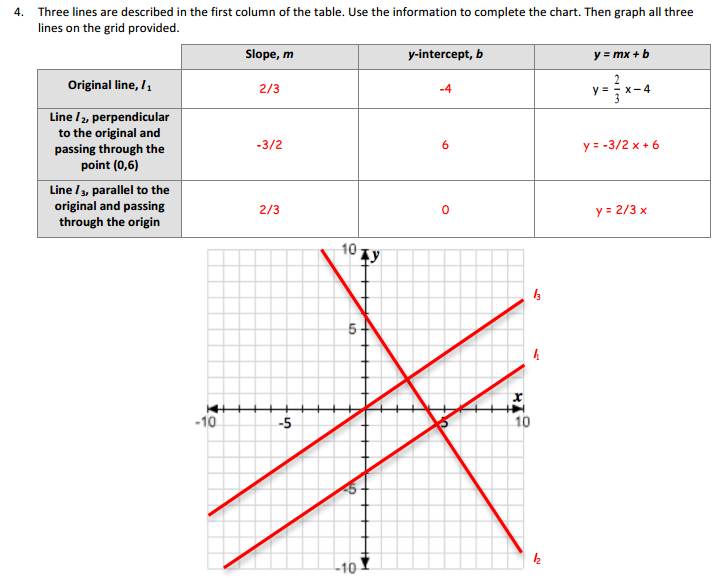
Assessment
This assessment requires students to dissect the given equation to determine the slope for a parallel and perpendicular line and then graph all the lines in the given problem.
Learning Progression: Linear Functions
CCSS Cluster: HSG Congruence Learning Progression

This learning progression would take place in a 10th/11th grade Geometry class and is aligned to multiple Common Core State Standards regarding “Congruence” – specifically HSG.CO.B.6, HSG.CO.B.7, and HSG.CO.B.8. This geometry courses uses the Holt Rinehart Winston Geometry textbook aided with an online resource, TeachersPayTeachers – All Things Algebra. This specific learning progression aligns directly with the TeachersPayTeachers worksheets. The guided notes and assignment are taken directly from this online resource.