HSF.BF.A1, HSF.BF.B3, HSF.LE.A2 – Building and Interpreting Exponential Functions

The attached learning progression details a 3 day excursion through the finer points of building and interpreting exponential functions.  Students will gain experience working with exponential functions and using the basic procedures to solve story problems.  The first day details the steps to solving a word problem using exponential growth and decay, including compounded interest.  The next day introduces story problems with logarithms and the number e.  The third day ties the other two together in the form of a review game where students can answer questions to gain points and, ultimately, win the activity.

The following Common Core standards are addressed:

HSF.BF.A.1: Write a function that describes a relationship between two quantities.*

HSF.BF.B.3: Identify the effect on the graph of replacing f(x) by f(x) + k, k f(x), f(kx), and f(x + k) for specific values of k (both positive and negative); find the value of k given the graphs. Experiment with cases and illustrate an explanation of the effects on the graph using technology. Include recognizing even and odd functions from their graphs and algebraic expressions for them.

HSF.LE.A.2: Construct linear and exponential functions, including arithmetic and geometric sequences, given a graph, a description of a relationship, or two input-output pairs (include reading these from a table).

Building and Interpreting Exponential Functions, a learning progression

Algebra 2: Understanding and Interpreting Functions

bettermathBlog_LP

In Algebra 2, a class for Juniors and mathematically proficient sophomores, the concepts of relations, functions and rate of change is introduced.  The attached learning progression follows chapter 2 sections 1 though 4 of the text, as well as aligning to multiple Common Core high school standards and involving various mathematical practices.  The specific standards are as follows:

  • HSF.IF.A.1
    Understand that a function from one set (called the domain) to another set (called the range) assigns to each element of the domain exactly one element of the range. If f is a function and x is an element of its domain, then f(x) denotes the output of f corresponding to the input x. The graph of f is the graph of the equation y = f(x).
  • HSF.IF.A.2
    Use function notation, evaluate functions for inputs in their domains, and interpret statements that use function notation in terms of a context.
  • HSF.IF.B.6
    Calculate and interpret the average rate of change of a function (presented symbolically or as a table) over a specified interval. Estimate the rate of change from a graph.*

Beginning with an introduction to relations, this series of lessons will introduce students to the topic of functions, rate of change and by the end of the progression students will be able to write equations for lines using both slope-intercept form and standard form.  This progression uses a variety of instructional methods, including some periods of direct instruction as well as discover-based learning scenarios.  Please see the click the link below to access the full learning progression for understanding and interpreting functions.

Algebra 2 – Understanding and Interpreting Functions

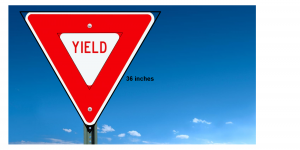
G.SRT Calculating the Area of a Traffic Sign

Alignment to Content Standards

HSG.SRT.C.6 Understand that by similarity, side ratios in right triangles are properties of the angles in the triangle, leading to definitions of trigonometric ratios for acute angles.

HSG.SRT.C.8 Use trigonometric ratios and the Pythagorean Theorem to solve right triangles in applied problems.*

Task

Yield signs are traffic signs shaped like an equilateral triangle. Estimate the area of the sign assuming that the triangle is an equilateral triangle (round to the nearest hundredth).  Explain how you got to your conclusion.

IMAssess_sign

The full task, including commentary and solution, can be found here.

HSG.GMD.A3 – Calculating the volume of grain silos

shutterstock_Silo

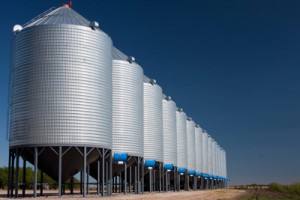
Depending on where you live, these grain silos can be a pretty familiar sight.  Silos are used to store the excess grain harvested from the fields and are especially popular in more agricultural areas.

For this problem, students will be tasked with finding the amount of grain in a silo given the measurements and the percentage of the silo that is full.  This problem can be easy – simply finding the max volume of the structure given the heights and radii – or it can be made more difficult – finding the amount grain if the silo is only partially full or even comparing the volumes of multiple silos using the concept of similarity.  The picture provides a visual representation of what the silos actually look like, making it easier for students to see the silo as two cones and a cylinder and not just a single structure.

CCSS.Math.Content.HSG.GMD.A.3

Use volume formulas for cylinders, pyramids, cones, and spheres to solve problems.*

CCSS.Math.Content.HSF.IF.B.6 – Fan Cart Derby

Vernier products open so many doors for educators today.  STEM teachers can now use a variety of probes and logging softwares to incorporate classroom experiments into their curriculum.  For example, students can learn about the inverse relationship between pressure and volume using Vernier’s gas sensor probe or students can explore what happens when you mix liquids of different temperatures using the temperature probe and a TI-83 calculator.  These are just two of the many different activities Vernier has on their website.  Instructors are not just limited to the experiments Vernier has already made, there are millions of possibilities available.  Below is an activity that utilizes Vernier’s CBR Motion Sensor to demonstrate the slope of a line as a rate of change.

Fan Cart Derby

Materials

  • Vernier CBR motion detector
  • Vernier EasyLink connector cable
  • Vernier fan cart
  • TI-83 or newer graphing calculator (must have EasyData)
  • Track (1m long)

The Activity

Students will use the different speed settings on the fan cart to realize that the slope of a line is equivalent to the rate of change (or in this case, the velocity of the cart).  The cart will go down the track towards the motion sensor which will display a graph on the graphing calculator using the EasyData app.

vernier_model

After recording the graph on the worksheet, students will analyze the graph to come up with an equation for the line as well as the slope.  Then, students will use the formula for velocity to find the speed of the cart.  This allows the students to interpret the slope of a line as a rate of change, and not just some number they used a formula to find.

Adaptations

This activity is geared more towards younger high school students – probably freshmen or sophomores.  However, it would be really easy to make a few tweaks to the experiment and worksheet to adapt this for a a high school calculus classroom.  After obtaining the distance/time graph from the fan cart and CBR sensor, calculus students could be asked to find the velocity of the cart using the derivative.  Going even further, once students have found the first derivative (velocity) they could then find the second derivative which would give them the acceleration.  This is why the experiment would have to be changed – because using a constant velocity would mean there was no acceleration.  Perhaps adding an incline to the track?

Worksheet

FanCartDerby_Worksheet

CCSS.Math.Content.HSG.C.B.5 – Pizza Party Gone Wrong

geogebra


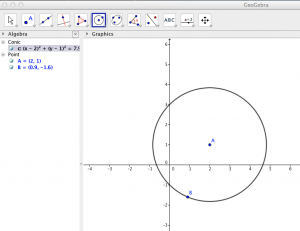
Geogebra is an incredibly useful tool in the classroom.  Not only does it allow the students to make their own constructions and explore geometry individually, it is also a good application for modeling mathematical concepts.   The numerous in-app tools and calculators gives the teacher an easy to manipulate visual representation that can boost student understanding.

geogbra_3

Attached is a lesson that utilizes Geogebra in a more demonstrative sense.  Students won’t actually get to construct anything on their own, but they will get to see the answer to the question they were working to figure out during the class period.  This lesson focuses on the deriving the formula for sector area, using instructional aid created in Geogebra. There is also an additional Geogebra file that cannot be attached to this post.


PizzaPartyGoneWrongLP

PizzaPartyGoneWrong