This learning progression will be taught in a high school sophomore algebra classroom. The common core standards that this learning progression aligns with are HSA.REI.C.5, HSA.REI.C.6, and HSA.REI.C.7. This progressi on also makes use of the following three mathematical practices: MP1: Make sense of problems and persevere in solving them, MP3: Construct viable arguments and critique the reasoning of others, and MP4: Model with mathematics. The lessons in this progression will take students from a basic understanding of linear equations, to a complete understanding of systems of equations and how to solve them. Students will learn to solve systems of equations using three methods: graphing, substitution, and combination.
Uncategorized
Systems of Equations Learning Progression
The learning progression will be used in a 9th grade high school class. The common core standards that this progression will be aligned to are HSA.REI.C.5, HSA.REI.C.6 and HSA.REI.C.7. Mathematical practices MP1: Make sense of problems and persevere in solving them, MP3: Construct viable argument and critique reasoning of others and MP5: Use appropriate tools strategically will be aligned to the learning progression as well.
Probability Learning Progression

The central focus of this learning segment is to understand how to find theoretical and experimental probability and how they are used to calculate percent error. The purpose of this content is to give students the mathematical tools to use in order to solve real-world scenarios involving probability. The underlying concepts are probability, fractions (adding, dividing, and multiplying), and percent. The simple knowledge in this lesson includes the all the vocabulary relating to probability, percent, and fractions; and how they are used together, such as probability of flipping a coin heads is ½ which is 50%. The procedures in this learning segment are stating the theoretical probability, finding the experimental probability, and then calculating the percent error. This learning segment covers the following three Common Core State Standards: CCSS.MATH.CONTENT.7.SP.C.5, CCSS.MATH.CONTENT.7.SP.C.6, and CCSS.MATH.CONTENT.7.SP.C.8.A. It also addresses the following Math Practices: CCSS.MATH.PRACTICE.MP4 and CCSS.MATH.PRACTICE.MP6.
High School Functions: Introductions
This learning progression will be applied to a 12th grade High School classroom and the Common Core State Standards that are aligned to this progression are in the “Understand the concept of a function and use function notation” cluster and include: CCSS.MATH.CONTENT.HSF.IF.A.1, CCSS.MATH.CONTENT.HSF.IF.A.2, and CCSS.MATH.CONTENT.HSF.IF.A.3.
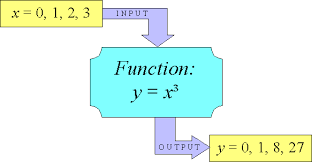
Students have had brief experience with functions in their past classes and earlier this year. This progression will take this experience and give the students a deeper level of understanding of functions. They will take their general knowledge and focus on the domain and range of functions and how this correlates to the independent and dependent variables of the function. Then students will engage their procedural understanding and calculation skills to use an input to find an output. The students will then generalize and abstract to understand that sequences can be thought to act like functions and can be modeled similarly to normal functions.
For more information click the following link:
REI.B.3 & 4: Quadratic Formula, Completing the Square, and Factoring. Oh my!
Just like Dorothy, the Tin Man, and the Scarecrow were scared of lions, and tigers, and bears in the Wizard of Oz, 10th grade students will most likely be scared of solving quadratic equations by completing the square, the quadratic formula, and factoring. However, through proper instruction, enough practice, and effective formative assessments, solving linear equations and inequalities and quadratic equations will be nothing to worry about.
This learning progression would be taught in a beginning 10th grade algebra classroom. The Common Core State Standards that will be addressed are HSA.REI.B.3, HSA.REI.B.4.A, and HSA.REI.B.4.B. Additionally, MP.4, MP.6, and MP.7 are the mathematical practice standards that align with this learning progression.
Since this is such a dense Common Core cluster, there will be four lessons that make up this learning progression. Students have previously learned what equations and expressions are and how they are different, how to categorize polynomials, steps to solving simple linear equations, and how to graph linear equations. The progression will begin by teaching the students how to solve more advanced linear equations and inequalities. This lesson may take a couple of days depending on how advanced the students are. The students will learn how to graph inequalities and how to attend to precision in writing their answers and labeling their graphs. For the second lesson, students will learn what completing the square means and how it is useful in finding roots of quadratic equations. Each time they complete the square, they will be required to draw a picture to show how they came up with the number that they are adding to both sides. An example of a problem on their worksheet, which is used as their formative assessment for this lesson, is provided below. Once students understand how to complete the square, they will move on to the third lesson and will learn what the quadratic formula is, how it is used, and how it can be derived from completing the square. Finally, the fourth lesson entails teaching students how to factor a quadratic equation when the leading coefficient is 1. By using frequent formative assessment techniques such as worksheets, class activities, and exit slips, the students and the teacher will both be able to track the students’ progress towards the learning targets.

The equations will be written on the board and the students will copy them from the board onto their equation box. They will then complete the picture and solution. They will have 4 pages scaffolded like the worksheet shown on the left. Picture taken from http://mathequalslove.blogspot.com.au/2015/05/algebra-2-solving-quadratics-inb-pages.html
Learning Progression: Learning Progression
S-ID Texting Champion
Task
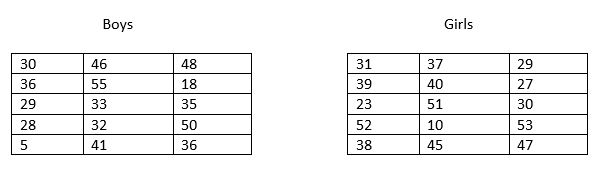
A student in Ms. Smith’s class claimed that girls text faster than boys. Naturally, the boys disagreed. Therefore, Ms. Smith’s statistics class did an activity where each student calculated the average words per minute they could text. The data is recorded below.
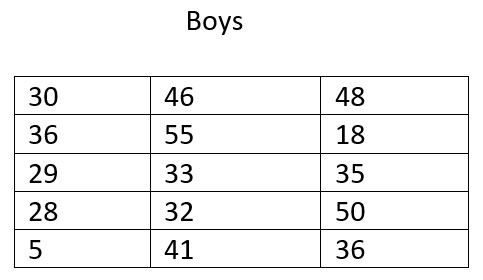
1. Sketch two side by side box plots to compare the average words per minute of girls and boys. Make sure to include the minimum, maximum, first and third quartiles, and median. Additionally, calculate the mean for each data set.
2. Why is the mean less than the median in both boys and girls?
3. Compare and contrast the two box plots. What does this mean when we are comparing words per minute between boys and girls?
4. If I was trying to describe the center of these distributions, would the mean or median be more appropriate?
5. Based upon the data presented above, which gender texts faster? Support your answer with statistical data.
An assessment commentary and solution is on the attached document: IM problem
HSN.Q.A.1 and HSA.CED.A.1 Flying Function
 Archery is considered to be one of the oldest sports in the world. Bows and arrows have been being used for hunting and for sport for over 25,000 years. So when trying to think of a way to incorporate the real world into a mathematics lesson, I thought what better way than to use archery to help students hit their learning target (pun intended). The unique flight of each arrow, not to mention the archer’s paradox, provides a math teacher many options when it comes to applying math to archery. Not only does archery have many connections to math, but it is something that a lot of the students are interested in. As the archery director at a summer camp, I had campers begging me to spend more time at the archery range. Even in my field experience classroom, at least 50% of my students are hunters and are constantly telling each other hunting stories.
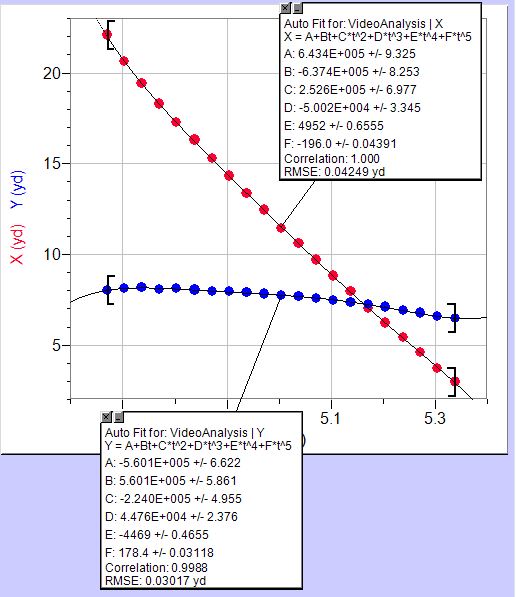
Recent advances in technology makes analyzing arrow flight simple and fun. The Logger Pro software by Vernier allows students to take a small clip of them shooting an arrow and analyze it frame by frame and to perform statistical analysis of the data. The students will be able to find the velocity of the arrow as it leaves the bow and compare it with the velocity of the arrow as it hits the target. This will hopefully spark a conversation about air resistance and other real-world factors that will affect mathematical predictions. Students will also be able to track the flight of the arrow and find the function that best fits that flight. No matter what type of function you choose, Logger Pro will come up with the constant multipliers for that function that best fits the flight of the arrow. This can open a discussion about margin of error.
Activity
Materials needed:
- Recurve or Longbow
- Flu Flu arrows (preferably with yellow fletching)
- Computers with Logger Pro software
- Targets
- Phone with video capabilities or camera
- Worksheet
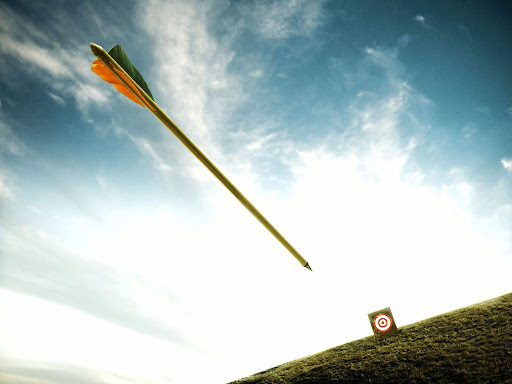
First, I will have the students take a guess at how quick they think that the arrow is flying. I will discuss with them that, in archery, speed (velocity) is commonly described by feet per second. We will have a short review about how when something is moving only forward, speed and velocity are the same thing. I will then have the students convert their feet per second guess into miles per hour and yards per hour. I will also have the students guess which type of function would best model the flight of an arrow. I will not require them to come up with an exact function, that is, they will not need to guess constants, but I am looking for an answer of linear, quadratic, exponential, cubic, quartic, quantic, etc. After the students have made their predications, we will go out to the football field and set up the targets. This is when I will teach them about safety and proper shooting form and they will be able to take a couple practice shots. By teaching them about safety, I am preparing students to be responsible citizens and archers. It’s up to the teacher how far away they want the students to shoot from. The farther away, the more curve you will see in the arrow. However, the farther away you are the less likely you are to see the arrow fly. I suggest shooting from about 20-30 yards. The students will take turns shooting and for safety reasons, I will be the one to take the video. All other students should be behind the shooting line. The videos will look similar to the one below.
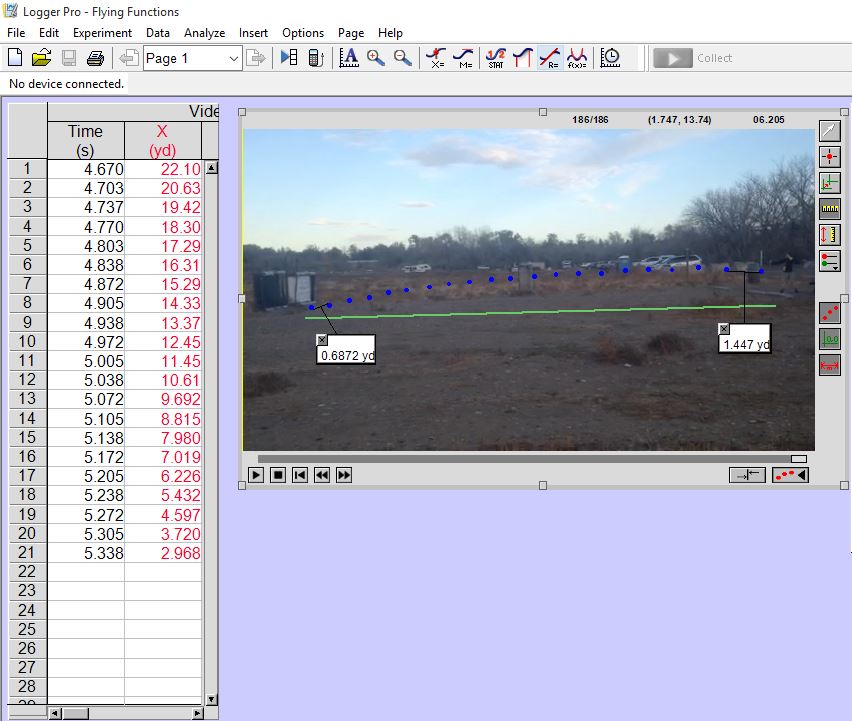
When the students analyze the speed on Logger Pro, they will realize that the initial speed of the arrow is going to be faster than the speed of the arrow as it hits the target. In my example, the arrow was initially going 43.848 yards/sec and then as it hit the target it was going 20.823 yards/sec. The students answers will initially be in yards/sec form and then I want them to convert it to feet/sec and then to miles/hour. I will then ask the students why they think the arrow slows down. Next, the students will analyze the video by graphing points on the actual video using Logger Pro. The students will then be able to compare the function they predicted to the function that Logger Pro says best fits their arrow flight. Note: you will probably have to teach the students how to use Logger Pro prior to this activity.
Barriers to Implementation/Adaptations
Since archery can be considered a dangerous sport, a teacher must be certified in order for students to be allowed to shoot archery on school grounds. There is an organization called National Archery in the Schools Program (NASP) which certifies teachers to be able to do just that. Typically, PE teachers are the ones that are certified; however, anyone is able to be certified and certification does not expire. I personally am certified so with support from a principle I would be able to implement this activity using real bows and arrows. If you’re not certified and have no desire to get certified, you can see if the PE teacher at your school is certified and if they are interested in supervising. If there is no way to have anyone certified present, you could also do this activity with a cheap nerf gun or have the students create a small homemade bow out of pencils and rubber bands. You could even shoot one video yourself on your own time and then have all the students analyze the same video instead of shooting their own. This activity could even be done with the flight of any other items, basketballs, baseballs, shoes, javelins, etc. So you do not necessarily have to do this activity with an arrow.
Parental and Community Involvement
My hope is that the students will be so excited about having shot arrows during math class that they will go home and tell their families all about it, thus, involving their families. Part of my reason for having the students convert their guesses and the actual speed of the arrow into miles per hour is so that the general community would understand the units with which they were talking about. Aside from archers, I’m not sure who commonly refers to distance in only yards and refers to speed in feet/sec. I want the students to not only be able to make the conversion but also be able to discuss the activity with others. Also, I will definitely be alerting the parents prior to this activity that the students will be shooting arrows during class. Even though flu flu arrows are not very dangerous at all in comparison to regular arrows, I still want the parents to be aware and involved. Hopefully, by letting the parents know that this activity is going to happen, they will be eager to ask their child about the activity and the student will be able to share with them.
The hunting and archer community is very unique in that, if you are a fellow archer or hunter, you’re almost automatically friends. People in this community love talking and telling each other stories, sometimes for hours upon end. By having the students shoot a couple arrows during class, I am supplying the students with stories and an experience that they will be able to contribute to the conversations if they are ever around other archers.
This activity aligns with the following common core state standards.
CCSS.MATH.CONTENT.HSN.Q.A.1
Use units as a way to understand problems and to guide the solution of multi-step problems; choose and interpret units consistently in formulas; choose and interpret the scale and the origin in graphs and data displays.
CCSS.MATH.CONTENT.HSA.CED.A.1 Create equations and inequalities in one variable and use them to solve problems. Include equations arising from linear and quadratic functions, and simple rational and exponential functions.
You can download the free demo version of Logger Pro at http://www.vernier.com/downloads/logger-pro-demo/
Worksheet:Flying Function worksheet
CCSS.MATH.CONTENT.HSF.TF.B.5: Sarah’s Bicycle Wheel
Visualizing certain real world objects such as a wheel of a bicycle may be a difficult based upon the student. Using the program of Logger Pro, the students are able to see how the function is generated based on a small video clip. Logger Pro, is a program that collects and analyses data on computers. It has a free demo option that anyone can use for one month. After the trial period, anyone who wants to use it for a longer period must buy it. The financial issue is one con of the program but there are many pros to the program.
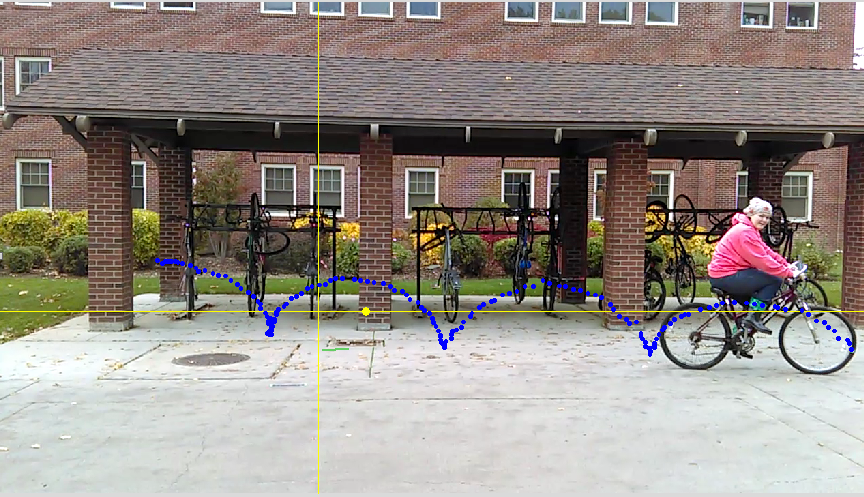
First of all, Logger Pro helps student visualize and analyze real world problems. For instance, in this lesson activity called “Sarah’s Bicycle Wheel,” the function that will be generated using Logger Pro will be from the revolutions of the front wheel based off a green marker on the side of the wheel. The students will start off with an introduction that will have them predict the function a bike wheel creates as a human rides the bicycle. Then students will be shown a video clip of an individual, named Sarah, to ride her bike in order to visualize the movement of the wheel. Please press play to watch the clip.
After the students have watched the video, the students will be able to compare their graphs that they wrote on their introduction worksheet to the graph that Logger Pro will create. Creating the graph of Sarah’s bicycle wheel is not hard to make. It is very simple for a student to also record a situation such as the one above. However, in this situation, the teacher will have this situation graphed so that the students can analyze the situation and continue on to having the students record their own situation and interpret their results.
This is the worksheet of the lesson, “Sarah’s Bicycle Wheel,” Sarah’s Bicycle Worksheets.
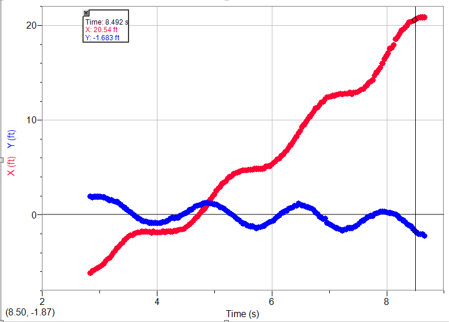
Logger Pro also has some good features that students are able to use. Down below is the tool bar that is listed on top of the Logger Pro program. The one highlight that says “X =” is useful to check at any point in time in the graph to see where the function is being graphed at. Underneath the tool bar is an image of “X =” being used. Below the picture, is a chart that has a line through 8.5 seconds. That line is the “X =” tool that a student can used to visually see the graph being created. The “X =” is an interactive tool and the students can move it from left to right to see how the graph is created.

This activity aligns with the Common Core Standard of CCSS.MATH.CONTENT.HSF.TF.B.5: Choose trigonometric functions to model periodic phenomena with specified amplitude, frequency, and midline. Logger Pro can create any functions that one may be analyzing. Using Logger Pro can help an individual find a sine, cosine, quadratic, linear, and other type of functions based on the video clip you want to analyze. In addition, after the students complete the introduction, the students will move on to a group project where the will be the ones to record a video clip of an individual on a small bike and on a regular adult bike. This will enable the students to interpret results and compare the results to those in the activity “Sarah’s Bicycle Wheel.” The students will be studying the questions and making predictions of these questions: “What did the function look like when we had a smaller bike such as a kids bike?” or “What happen if Sarah went faster on her bike?”
Logger Pro is beneficial for students to visualize and analyze real world situations such analyze the revolution of Sarah’s Bicycle wheel to see the function that it generates. This activity can also help students use the revolutions that the bicycle wheel has created in order to figure out how long Sarah will have to travel for if she needs to go 480 feet at the rate she is traveling. Overall, Logger Pro is a great tool to use because it can help students analyze a certain real world problem that they may want to learn more from.
Hey! Wait Up!- CCSS.MATH.CONTENT.8.EE.C.8
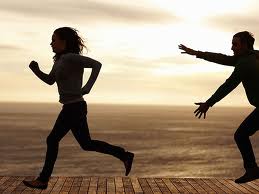 Imagine you are walking to class and you see your friend up ahead so you run to catch up with him. Can you model this situation mathematically? Of course you can! Assuming that you and your friend are moving at constant speeds, you can set up a system of linear equations. You can model this graphically by plotting distance versus time. If you were to plot the lines on the same set of axes, the point where the two lines cross would represent the physical location where you passed your friend.
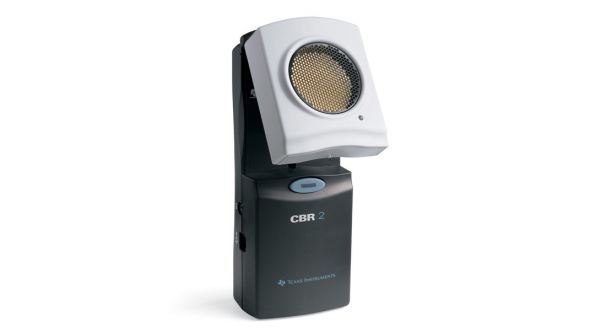
It is possible to create models for situations like this in the classroom using Vernier CBR2 Motion Detectors.
In the Hey! Wait Up! activity, students will work in groups of four: 2 people will be the walkers, 1 person will start the motion detector and operate the stopwatch, and 1 person will mark the point where the walkers intersect. Each group will work together to collect and analyze motion data in order to determine the solution to a linear system of equations using a graphing calculator. They will then check this solution by creating a system of linear equations and solving it by hand. This activity is best done after the students have been introduced to systems of linear equations and how to solve them.
To complete the The Hey! Wait Up! activity each group will need 2 Vernier CBR2 Motion Detectors (with appropriate cables), a TI83 or TI84 calculator, a meter stick, and a stopwatch.
This lesson aligns with the following Common Core State Standards:
CCSS.MATH.CONTENT.8.EE.C.8– Analyze and solve pairs of simultaneous linear equations.
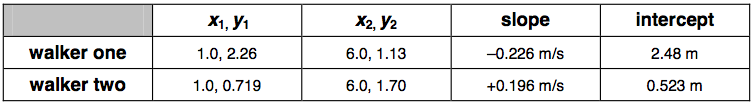
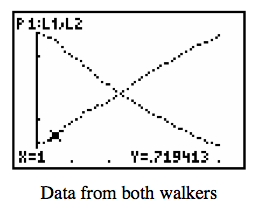 Students will be using the calculator results to find the coordinates of two points for both lines which they will then use to find the slopes of each line. Students will also use the calculator results to find the y-intercept of each line. Using this information, students will be able to create equations for the lines that they will then use to make a system of linear equations and solve.
CCSS.MATH.CONTENT.8.EE.C.8.A– Understand that solutions to a system of two linear equations in two variables correspond to points of intersection of their graphs, because points of intersection satisfy both equations simultaneously.
At the end of this activity, students will be able to connect that the point where they crossed when walking is the point where the two lines intersect and that this coordinate point is the solution to the system of linear equations.
To conclude this activity, students will be given an exit slip that asks:
- In your own words, what is a system of linear equations?
- Give me an example of a real world situation (that does not involve walking/ running) that you could model using a system of linear equations.
From this you can determine and gauge your students’ conceptual understanding as well as see if they can apply the idea of using systems of linear equations to model other everyday experiences.
A benefit of using Vernier Motion Detectors when teaching the concept of systems of linear equations is that it makes the concept personal for the students. It helps bring mathematics out of the classroom and into the real world. Rather than seeing the systems of linear equations as just lines on the graph, they can see that in this situation those lines represent something, namely the students’ walks. This activity also gets the students involved in their own learning by having them get up and move around when they are doing the walking activities and collecting the data. This makes the data concrete for them rather than just some numbers, equations, and coordinates they have to work with in order to find a solution.
![]()
A Vernier CBR2 Motion Detector costs $99. To buy or to find out more about the Vernier CBR2 Motion Detector visit http://www.vernier.com/products/sensors/motion-detectors/cbr2/
To find out more about Vernier Software & Technology and explore their other products visit http://www.vernier.com/
Hey! Wait Up! worksheet: Hey! Wait Up!-Systems of Linear Equations with Vernier Motion Detectors
CCSS.Math.Content.HSS.S.ID.5 Is Bigger Always Better?

Understanding correlation and causality is difficult at times. In Statistics, students are asked to understand what it means for data to be correlated. This usually involves looking at tables and graphs and making guesses, all of which can be extremely boring for student. They can’t engage with a graph or a table, they need something to pull them in and grab their attention. Vernier Software & Technology products are an intuitive and interactive way to get students engaged in Mathematics. The Vernier Anemometer shows students that Mathematics is more than a class in school, its everywhere in life.
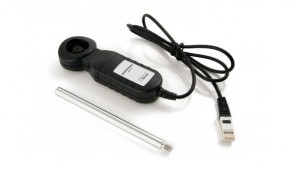
The Vernier Anemometer is a small handheld probe that plugs into a TI Calculator or a computer that measures wind speed. It can measure speeds of 1 to 30 meters per second, or 1 to 67 miles per hour.This product can be used with a computer program called Logger Pro 3 to record finding and make graphs to represent data. Practical uses of this device are countless. Students can use this device to study wind patterns over a period of time to find the average wind speed during the week, use it to measure who runs the fastest based on how fast they can have the Anemometer read, or use it to find out if there is a pattern to wind speeds during the day, among other ideas.
One specific example is for students to measure who can blow the fastest and use their findings to study correlation. This type of project can be done in groups or as a whole class. In either situation, we would first ask the student to try their best to blow as hard as they can to see who can blow the hardest. Give each students a few tries and then collect the data from each person for the whole class to use (the collection can be done on the calculator or using the Logger Pro 3 program for the computer). After a winner is decided, a teacher can ask the class is they think they know why certain people did better than others. Have them pick 4 to 6 factors that could explain why certain people blew harder. These factors could be: height, age, weight, shoe size, whether or not they play sports, or gender. Regardless of the factors they choose, have the students gather information from the rest of their classmates related to the factors. Students can then take the information and create tables and graphs to organize the information. Using the graphs and tables students can then determine if they think the data shows a correlation or an association between the factor and how hard the student blew. Then students can use the TI Calculators to perform linear regressions to verify their reasoning.
In this specific lesson, the target standard in the Common Core State Standards for High School Statistics is CCSS.Math.Content.HSS.S.ID.5 “Summarize categorical data for two categories in two-way frequency tables. Interpret relative frequencies in the context of the data (including joint, marginal, and conditional relative frequencies). Recognize possible associations and trends in the data.” Students are able to personally collect concrete data to compare and, using Math, determine possible associations or trends in data.
This type of lesson could be modified to align with any of the below standards, including: CCSS.Math.Content.HSS.S.ID.6.a “Represent data on two quantitative variables on a scatter plot, and describe how the variables are related. Fit a function to the data; use functions fitted to data to solve problems in the context of the data. Use given functions or choose a function suggested by the context. Emphasize linear, quadratic, and exponential models.”, CCSS.Math.Content.HSS.S.ID.6.b “Informally assess the fit of a function by plotting and analyzing residuals.”, or CCSS.Math.Content.HSS.S.ID.6.c “Fit a linear function for a scatter plot that suggests a linear association.”
![]()
The benefit of using this Vernier instrument or any other Vernier instruments is that student can collect and work with data that is personal to them. The number aren’t just number in a book, those numbers are the activity and the fun they had collecting them. These numbers are from real life and add an element of concreteness to something that is abstract like Math. So interpreting data becomes personal. It comes to life. Students will take a positive experience away from this Math assignment that can shape their perception and understanding of the important and usefulness of Math.
The Vernier Anemometer can be found for $89.00 along with information here: http://www.vernier.com/products/sensors/anm-bta/
The Logger Pro 3 program can be found for $249.00 along with information and deals and incentives for schools here: http://www.vernier.com/products/software/lp/
More information about Vernier products and lessons with lesson plans can be found here: http://www.vernier.com/
Example worksheet: Full of Hot Air Worksheet