Unit: Quadratic Equations

Students will be learning about quadratic equations in an Algebra II class at Wahluke High School in Mattawa, Washington. The students will learn how to graph quadratic equations by evaluating x values, in standard form, and vertex form. The Common Core Math Standards aligned to this learning progression are CCSS.MATH.CONTENT.HSF.IF.A.2CCSS.MATH.CONTENT.HSF.IF.C.7.A, and CCSS.MATH.CONTENT.HSF.IF.C.7. The students will also be demonstrating three Mathematical Practices of MP1, MP4, and MP6 through the group collaboration, peer support, and formal and informal assessments. The students will be given a worksheet. The students will be working with a partner to complete the worksheet. A sample problem is shown below:

  1. Given f(x)=3x^2-5x-2 answer the questions below.
    1. What is a, b, and c?
    2. Will f(x) be open upward or downward? Why?
    3. What is the value? Will the f(x) be wide or narrow? Why?
    4. Find the vertex coordinate point. Show your work.
    5. Find the axis of symmetry. Make sure to state what the axis of symmetry.

The students will be assessed on the amount of points that are correct on the worksheet. The points will be counted as part of the students’ grade in the class. The students’ score will be used as feedback that will be implemented in the next lesson.

Below is the Learning Progression and the lesson plan:

Math 499E Learning Progression

Math 499E Lesson Plan edTPA

Pythagorean Theorem/Trigonometric Ratios

At one point in every students educational career, they encounter the Pythagorean Theorem and the Trigonometric Ratios. A learning progression must be developed in order to teach the students both concepts and understand how they connect.

The learning progression that will be shown in this post will be about the Pythagorean Theorem and the trigonometric ratios for an Algebra 1 course. For the learning progression, the first cluster that will be used is: Understand and apply the Pythagorean Theorem. The Common Core Math Standards that fall under it are: CCSS.MATH.CONTENT.8.G.B.6: Explain a proof of the Pythagorean Theorem and its converse. Also, CCSS.MATH.CONTENT.8.G.B.7: Apply the Pythagorean Theorem to determine unknown side lengths in right triangles in real-world and mathematical problems in two and three dimensions.

The second cluster is: Define trigonometric ratios and solve problems involving right triangles. The Common Core Math Standards are the cluster is: CCSS.MATH.CONTENT.HSG.SRT.C.6: Understand that by similarity, side ratios in right triangles are properties of the angles in the triangle, leading to definitions of trigonometric ratios for acute angles. Also, CCSS.MATH.CONTENT.HSG.SRT.C.8: Use trigonometric ratios and the Pythagorean Theorem to solve right triangles in applied problems.*

The Mathematical Practices used for the learning progression are: MP1: Make sense of problems and persevere in solving them. MP4: Model with mathematics. MP5: Use appropriate tools strategically. MP6: Attend to precision.

In addition, the students will be assessed informally and formally for each lessons of the learning progression. The students will asked various questions to check for understanding throughout each lesson. The students will be following along in the classroom and they will be doing worksheets to demonstrate and practice their skills. One of the assignments they will be given is on a worksheet of trigonometric ratios. The students will be calculating the six trigonometric ratios based on the values of the sides of a triangle. In addition, exit tasks will be given out for each lesson as well. The exit tickets will be feedback to the teacher, which will help organize the lesson for the next day. For instance, for day one, the students will be learning about the Pythagorean Theorem and be applying the theorem to solve problems. The problem students will work on for the exit task is: “Find the length of a ladder that is 12 meters and is leaning against a 10 meter building. How far is the ladder from the building?” Shown below is a sketch of the building, the grass, and the ladder. This formative assessment of an exit task will help the teacher gain insight on the level of mastery the students are at by the end of the leson.

Ladder

In the end, the Pythagorean Theorem and the trigonometric ratios are important concepts for students to learn. The assessments, benchmarks, exit tasks, and warm-ups must be organized and presented in an appropriate manner to maximize learning for the students in the classroom.

Below is the learning progression:

Pythagorean Theorem Learning Progression

HSF.IF.A.2-Lenard’s Truck Payments

Task

Lenard bought a brand new truck for $26,655. This truck will help him move more items from place to place easier. When Lenard bought the truck he made a down payment of $5,000. He will be making monthly payments of $355. However, Lenard is wondering how many months it will take him to pay off his truck.

Truck

Given the information above, Lenard’s situation is represented in function notation:

f(x) = -$355x + $21,655, where x is represented in months.

  1. Evaluate Lenard’s function by using the x-input values in the table below to find the y-values of the function. Show your work for each x values you substitute into on a separate sheet of paper and attached to this work sheet.

Truck Table

Part 2:
In the space below, write a statement for Lenard and explain to him how many months it would take him to pay off his truck. Show algebraically that the months that you found is the correct amount of months to pay off his truck.

Note: I have attached the assessment task, commentary, and solution for this problem: Task,Commentary,Solution.

HSG.GMD.A.3-Rolls of Hay on the Farm

The object that should be the main focus in the picture is the roll of hay that is seen in closer to you. This picture is usually seen in a rural area where farmers are creating the hay in the roll of hay. However, some students have have seen bails of hay that are rectangular instead in a cylinder shape. This picture may ignite motivation in students to complete a problem that has to do with agriculture of this type because it deals with a real world situation and they live in an area that have hay farms.

When viewing the picture below, all the students see are rolls of hay in a field of grass.

hay-rolls-5

(Picture was found at: https://rprtphoto.wordpress.com/tag/bale/)

The problem that the students will focus on is finding the volume of one roll of hay given specific measurements where height is 5 ft and the radius is 2.5 ft. View the picture below. The students will need to know the volume of a cylinder in order to do the problem. Moreover, this problem is aligned to the Common Core Standard: CCSS.MATH.CONTENT.HSG.GMD.A.3: Use volume formulas for cylinders, pyramids, cones, and spheres to solve problems.*

Hay bails

In addition, if a teacher wanted to extend the problem of calculating the volume of one roll of hay, the teacher can have the students solve different heights and radius of rolls of hay and solve which size of hay is the better buy for the money. Or the teacher can ask: “How many rolls of hay can fit on a hay trailer that is 6 and half feet in width and 37 and half feet in length?” The students will need to use the width (height) and the diameter in order to see how many can fit on the hay trailer.

CCSS.MATH.CONTENT.HSF.TF.B.5: Sarah’s Bicycle Wheel

Visualizing certain real world objects such as a wheel of a bicycle may be a difficult based upon the student. Using the program of Logger Pro, the students are able to see how the function is generated based on a small video clip. Logger Pro, is a program that collects and analyses data on computers. It has a free demo option that anyone can use for one month. After the trial period, anyone who wants to use it for a longer period must buy it. The financial issue is one con of the program but there are many pros to the program.

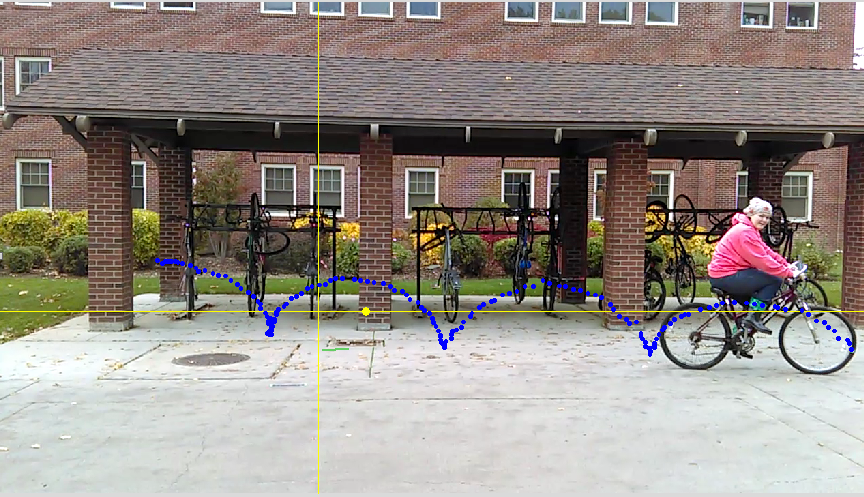
First of all, Logger Pro helps student visualize and analyze real world problems. For instance, in this lesson activity called “Sarah’s Bicycle Wheel,” the function that will be generated using Logger Pro will be from the revolutions of the front wheel based off a green marker on the side of the wheel. The students will start off with an introduction that will have them predict the function a bike wheel creates as a human rides the bicycle. Then students will be shown a video clip of an individual, named Sarah, to ride her bike in order to visualize the movement of the wheel. Please press play to watch the clip.

After the students have watched the video, the students will be able to compare their graphs that they wrote on their introduction worksheet to the graph that Logger Pro will create. Creating the graph of Sarah’s bicycle wheel is not hard to make. It is very simple for a student to also record a situation such as the one above. However, in this situation, the teacher will have this situation graphed so that the students can analyze the situation and continue on to having the students record their own situation and interpret their results.

This is the worksheet of the lesson, “Sarah’s Bicycle Wheel,” Sarah’s Bicycle Worksheets.

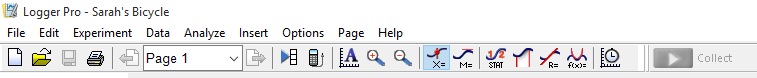
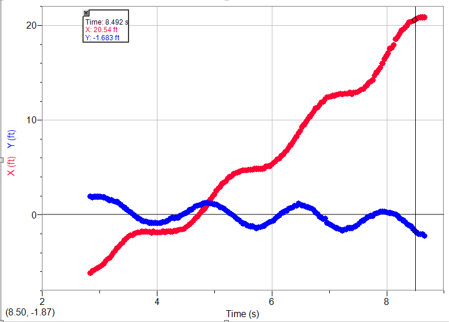
Logger Pro also has some good features that students are able to use. Down below is the tool bar that is listed on top of the Logger Pro program. The one highlight that says “X =” is useful to check at any point in time in the graph to see where the function is being graphed at. Underneath the tool bar is an image of “X =” being used. Below the picture, is a chart that has a line through 8.5 seconds. That line is the “X =” tool that a student can used to visually see the graph being created. The “X =” is an interactive tool and the students can move it from left to right to see how the graph is created.

FileSarahSBB

This activity aligns with the Common Core Standard of CCSS.MATH.CONTENT.HSF.TF.B.5: Choose trigonometric functions to model periodic phenomena with specified amplitude, frequency, and midline. Logger Pro can create any functions that one may be analyzing. Using Logger Pro can help an individual find a sine, cosine, quadratic, linear, and other type of functions based on the video clip you want to analyze. In addition, after the students complete the introduction, the students will move on to a group project where the will be the ones to record a video clip of an individual on a small bike and on a regular adult bike. This will enable the students to interpret results and compare the results to those in the activity “Sarah’s Bicycle Wheel.” The students will be studying the questions and making predictions of these questions: “What did the function look like when we had a smaller bike such as a kids bike?” or “What happen if Sarah went faster on her bike?”

Logger Pro is beneficial for students to visualize and analyze real world situations such analyze the revolution of Sarah’s Bicycle wheel to see the function that it generates. This activity can also help students use the revolutions that the bicycle wheel has created in order to figure out how long Sarah will have to travel for if she needs to go 480 feet at the rate she is traveling. Overall, Logger Pro is a great tool to use because it can help students analyze a certain real world problem that they may want to learn more from.

CCSS.MATH.CONTENT.HSG.GMD.A.3: Solving the Volume of 3 Dimensional Shapes Using GeoGebra Three Dimensional Graphics.

GeoGebra’s three dimensional graphics is used to assist the students in creating a visual of three dimensional models. The students will learn how to use GeoGebra and use the volume tool to calculate the volume of three dimensional objects. GeoGebra can allow the students to create their own three dimensional objects that they have created in their mind. They are allowed to rotate the object in all directions. They can calculate the volume and area of any objects. GeoGebra is used to assist the students in verifying the volume of an object.

When using the GeoGebra 3 dimensional graphics it is fairly simple to use. One must be on the Geogebra.org website. Click on “Start GeoGebra.” Then by clicking on the bottom center “3-D,” it will lead us to the 3 dimensional graphics tool. Once on the page, you will see a tool bar on the top of the page and the three dimensional axis on the right of the page. To begin with, graphing a cone will be the first step. Using the tool bar, we will scroll all the way to the left and click on the pyramid. It should look like a 3 dimensional object in the square. Then after clicking on that, we can click on the desired shape. Going to click on the cone, we then go to the three dimensional axis and click on any point where you want. Then click go up to the height you want and click on the number. Then will pop up a radius tool where you will put in the radius that is desired. Then the three dimensional object will appear on the three dimensional object. Thus, the object is created. Also, we can rotate the object to view all perspectives of the object. Any person can do this by using the Rotate 3D Graphics Tool, which is the last square in the tool box. Therefore, using the three dimensional graphics tool in GeoGebra can be used to create three dimensional objects that can help students view three dimensional object.

3 Dimensional


In the worksheet, Solving the Volume of 3 Dimensional Shapes Using GeoGebra, the worksheet is created to have the students gain the best understanding. The questions in the worksheet are scaffold from the least difficult to the most difficult such as “What is the radius and height?” and “What is the volume of the pyramid?” I wanted the questions to be worked up in the degree of difficulty so that the student can ask for help in a particular section that they are struggling in such as the order of operations when calculating the volume. I also provide a picture of the object that the students will be calculating so they can verify the shape on GeoGebra. Moreover, some students can not picture what a three dimensional object looks like so GeoGebra’s three dimensional graphics is the perfect option to help the students who are not visual learners. In addition, GeoGebra is also a perfect option for ELL learners to learn how to interpret the situation because they are able to manipulate with the three dimensional object and see how the volume increases as the object is bigger.

Below are the links to GeoGebra’s three dimensional graphics, the lesson plan, and the worksheet for this lesson.

Website: http://web.geogebra.org/

Lesson Plan: The Modeling Lesson Plan

Worksheet:Three Dimensional Shapes Worksheet

Below are images of three dimensional shapes constructed using GeoGebra’s three dimensional graphics.sphere

cone