
Understanding correlation and causality is difficult at times. In Statistics, students are asked to understand what it means for data to be correlated. This usually involves looking at tables and graphs and making guesses, all of which can be extremely boring for student. They can’t engage with a graph or a table, they need something to pull them in and grab their attention. Vernier Software & Technology products are an intuitive and interactive way to get students engaged in Mathematics. The Vernier Anemometer shows students that Mathematics is more than a class in school, its everywhere in life.
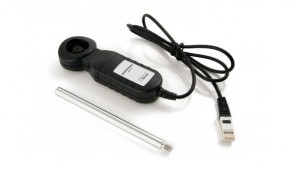
The Vernier Anemometer is a small handheld probe that plugs into a TI Calculator or a computer that measures wind speed. It can measure speeds of 1 to 30 meters per second, or 1 to 67 miles per hour.This product can be used with a computer program called Logger Pro 3 to record finding and make graphs to represent data. Practical uses of this device are countless. Students can use this device to study wind patterns over a period of time to find the average wind speed during the week, use it to measure who runs the fastest based on how fast they can have the Anemometer read, or use it to find out if there is a pattern to wind speeds during the day, among other ideas.
One specific example is for students to measure who can blow the fastest and use their findings to study correlation. This type of project can be done in groups or as a whole class. In either situation, we would first ask the student to try their best to blow as hard as they can to see who can blow the hardest. Give each students a few tries and then collect the data from each person for the whole class to use (the collection can be done on the calculator or using the Logger Pro 3 program for the computer). After a winner is decided, a teacher can ask the class is they think they know why certain people did better than others. Have them pick 4 to 6 factors that could explain why certain people blew harder. These factors could be: height, age, weight, shoe size, whether or not they play sports, or gender. Regardless of the factors they choose, have the students gather information from the rest of their classmates related to the factors. Students can then take the information and create tables and graphs to organize the information. Using the graphs and tables students can then determine if they think the data shows a correlation or an association between the factor and how hard the student blew. Then students can use the TI Calculators to perform linear regressions to verify their reasoning.
In this specific lesson, the target standard in the Common Core State Standards for High School Statistics is CCSS.Math.Content.HSS.S.ID.5 “Summarize categorical data for two categories in two-way frequency tables. Interpret relative frequencies in the context of the data (including joint, marginal, and conditional relative frequencies). Recognize possible associations and trends in the data.” Students are able to personally collect concrete data to compare and, using Math, determine possible associations or trends in data.
This type of lesson could be modified to align with any of the below standards, including: CCSS.Math.Content.HSS.S.ID.6.a “Represent data on two quantitative variables on a scatter plot, and describe how the variables are related. Fit a function to the data; use functions fitted to data to solve problems in the context of the data. Use given functions or choose a function suggested by the context. Emphasize linear, quadratic, and exponential models.”, CCSS.Math.Content.HSS.S.ID.6.b “Informally assess the fit of a function by plotting and analyzing residuals.”, or CCSS.Math.Content.HSS.S.ID.6.c “Fit a linear function for a scatter plot that suggests a linear association.”
![]()
The benefit of using this Vernier instrument or any other Vernier instruments is that student can collect and work with data that is personal to them. The number aren’t just number in a book, those numbers are the activity and the fun they had collecting them. These numbers are from real life and add an element of concreteness to something that is abstract like Math. So interpreting data becomes personal. It comes to life. Students will take a positive experience away from this Math assignment that can shape their perception and understanding of the important and usefulness of Math.
The Vernier Anemometer can be found for $89.00 along with information here: http://www.vernier.com/products/sensors/anm-bta/
The Logger Pro 3 program can be found for $249.00 along with information and deals and incentives for schools here: http://www.vernier.com/products/software/lp/
More information about Vernier products and lessons with lesson plans can be found here: http://www.vernier.com/
Example worksheet: Full of Hot Air Worksheet