Functions: Transformations and Finding Parents

function-translation-e

This Learning Progression will take place in a 12th grade Collection of Evidence class at the Excel High School in Ellensburg School district located in Black Hall on Central Washington University Campus. There is no scripted curriculum for this class and not content restrictions or goals set by the mentoring teacher. The content that is taught is decided by the instructor and the purpose is to prepare the students for entering the work force and having the math skills to be successful. These lessons will align with the mathematics content standards HSF.BF.B.3. The Learning Progression will also be aligned with the following mathematical practices: MP5 Use appropriate tools strategically, MP7 Look for and make use of structure, and MP1 Make sense of problems and persevere in solving them.

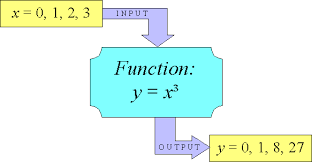
Students have spent the year learning various basic math skills that covers subjects from finding areas and volumes, to statistical analysis, and all the way to basic optimization problems. These were learnt to pass a test to ensure that the students would be able to graduate high school. Now that the tests are completed the student have little motivation to complete anymore content. The course content that was covered was expansive but did not rigorously cover each of the topics in depth. Therefore, this progressions goal is to take one of the subjects that was covered, specifically functions, and study it more in depth. The purpose of the focused approach is to create a new goal to work towards: a modeling project. The student will create a model that represents something that has meaning to them. To better understand how this model works they need to understand how functions work. So this progression will cover more complex concepts regarding functions. The students will build off of their basic understanding of functions and their basic algebra and graphing skills to understand function transformations, compositions, and inverses so that these can be tools that the students can use in making their models. Since their content understanding is limited, the depth of this discussion of functions will be limited to linear and quadratic functions.

To foster better learning and peer tutoring, the students will be exposed to a mix of cooperative learning and ability grouping. Students who are excelling, who are meeting expectations, and who are no meeting expectations will be grouped in equal amounts. This will give the opportunity for struggling students to get more help that what the teacher can provide individually and will allow the students who are meeting expectation and those who are excelling to tutor the struggling student to improve their own understanding of the materials being taught. This is particularly beneficial for students with exceptionalities and those who are bilingual or multi-lingual learners. These students can be grouped with more fluent students to practice their math skills as well as practice their speech.

The goal of this Learning Progression is to have the students develop an understanding of the relationship between a parent function and functions that are generated from transforming that parent function. They will learn the ways a linear function and a quadratic function can be transformed. Each student will leave the lesson with the ability to identify parent functions, formalize a transformation in words and in function notation, and generate functions given a parent function and a list of transformations.

Below are the documents that are relevant to this Learning Progression:

edTPA Lesson Plan Winter 2016 edTPA Worksheets Winter 2016

edTPA Worksheets Winter 2016

edTPA Learning Progression

High School Functions: Introductions

images


This learning progression will be applied to a 12th grade High School classroom and the Common Core State Standards that are aligned to this progression are in the “Understand the concept of a function and use function notation” cluster and include: CCSS.MATH.CONTENT.HSF.IF.A.1, CCSS.MATH.CONTENT.HSF.IF.A.2, and CCSS.MATH.CONTENT.HSF.IF.A.3.
 

Students have had brief experience with functions in their past classes and earlier this year. This progression will take this experience and give the students a deeper level of understanding of functions. They will take their general knowledge and focus on the domain and range of functions and how this correlates to the independent and dependent variables of the function. Then students will engage their procedural understanding and calculation skills to use an input to find an output. The students will then generalize and abstract to understand that sequences can be thought to act like functions and can be modeled similarly to normal functions.


For more information click the following link:


High School Functions

HS-G-CO Finding Points

Alignment to Content Standards: HSG-CO.D.12


Tasks:

Perform the specified constructions on the triangles below using a compass and straight edge. For each give the necessary steps to the right of figures.


  • Incenter

Capture3


  • Circumcenter

Capture3


  • Line Parallel to the Given Line


Capture4

IM Assessment

Note:

The worksheet, commentary, and solutions are included in the above link.

Bridging Between Math and the Real World – HSA.CED.A.1

Golden Gate Bridge

Math can be difficult to visualize and can seem pointless without context. Pictures are a great way to give students a frame of reference for visualizing a scenario or give them a real world application. Take for example this picture of the Golden Gate bridge in San Francisco, CA. A teacher could use this picture to introduce a section of applications of quadratics in story problems. They could use the Golden Gate Bridge to introduce or remind students what a suspension bridge looks like. The teacher would then go on to ask the class how math is used to create and design these bridges. Regardless of the suggestions, the teacher should hint at the idea of how it is necessary to know the heights of the suspension cables if you are cutting the cables to length. Student would then work to develop a quadratic function that determines the height of the suspension cables based on the distance away from the center of the bridge. In order to do a story type problem, there would need to be an additional picture with number. The problem could be written as follows:

600px-Golden-Gate-Bridge.svg


“The height of the suspension cables from the deck of the bridge form a parabola, as you can see in the picture. When I stand in the middle of the bridge, the suspension cables are 15 ft tall. If I walk 30 ft in either direction they are 35 ft tall. How tall are the suspensions cables if I walk 400 ft? How far would I need to walk to find cables that are 100 ft tall? Write a quadratic function to model the suspension cables on this bridge.”

This question targets the following Common Core State Standard:

CCSS.MATH.CONTENT.HSA.CED.A.1
“Create equations and inequalities in one variable and use them to solve problems.Include equations arising from linear and quadratic functions, and simple rational and exponential functions.”

This type of lesson would engage a variety of students. The lower achieving student and students who are most likely to be going into trades instead of looking at a four year degree would be interested in construction perspective. They can see how a person who is having to install the bridge and assemble or manufacture pieces needs math to do a good job. These students can develop a appreciation for math that is based on necessity for the work place. The higher achieving students and those students who are looking at four year degrees would be interested in the less hands on aspects. The students who might want to be architects, engineers, or analysts can see the applications of math in the planning and supervision of the project.

Additionally, all students have family or know someone who works in a job in either construction, engineering, or another job related to building. In this way the teacher will be using the community and personal assets of the students to engage students and make math relevant.

CCSS.Math.Content.HSS.S.ID.5 Is Bigger Always Better?

blowing a bubble

Understanding correlation and causality is difficult at times. In Statistics, students are asked to understand what it means for data to be correlated. This usually involves looking at tables and graphs and making guesses, all of which can be extremely boring for student. They can’t engage with a graph or a table, they need something to pull them in and grab their attention. Vernier Software & Technology products are an intuitive and interactive way to get students engaged in Mathematics. The Vernier Anemometer shows students that Mathematics is more than a class in school, its everywhere in life.

Anemometer

The Vernier Anemometer is a small handheld probe that plugs into a TI Calculator or a computer that measures wind speed. It can measure speeds of 1 to 30 meters per second, or 1 to 67 miles per hour.This product can be used with a computer program called Logger Pro 3 to record finding and make graphs to represent data. Practical uses of this device are countless. Students can use this device to study wind patterns over a period of time to find the average wind speed during the week, use it to measure who runs the fastest based on how fast they can have the Anemometer read, or use it to find out if there is a pattern to wind speeds during the day, among other ideas.

One specific example is for students to measure who can blow the fastest and use their findings to study correlation. This type of project can be done in groups or as a whole class. In either situation, we would first ask the student to try their best to blow as hard as they can to see who can blow the hardest. Give each students a few tries and then collect the data from each person for the whole class to use (the collection can be done on  the calculator or using the Logger Pro 3 program for the computer). After a winner is decided, a teacher can ask the class is they think they know why certain people did better than others. Have them pick 4 to 6 factors that could explain why certain people blew harder. These factors could be: height, age, weight, shoe size, whether or not they play sports, or gender. Regardless of the factors they choose, have the students gather information from the rest of their classmates related to the factors. Students can then take the information and create tables and graphs to organize the information. Using the graphs and tables students can then determine if they think the data shows a correlation or an association between the factor and how hard the student blew. Then students can use the TI Calculators to perform linear regressions to verify their reasoning.

In this specific lesson, the target standard in the Common Core State Standards for High School Statistics is CCSS.Math.Content.HSS.S.ID.5 “Summarize categorical data for two categories in two-way frequency tables. Interpret relative frequencies in the context of the data (including joint, marginal, and conditional relative frequencies). Recognize possible associations and trends in the data.” Students are able to personally collect concrete data to compare and, using Math, determine possible associations or trends in data.

This type of lesson could be modified to align with any of the below standards, including: CCSS.Math.Content.HSS.S.ID.6.a “Represent data on two quantitative variables on a scatter plot, and describe how the variables are related. Fit a function to the data; use functions fitted to data to solve problems in the context of the data. Use given functions or choose a function suggested by the context. Emphasize linear, quadratic, and exponential models.”, CCSS.Math.Content.HSS.S.ID.6.b “Informally assess the fit of a function by plotting and analyzing residuals.”, or CCSS.Math.Content.HSS.S.ID.6.c “Fit a linear function for a scatter plot that suggests a linear association.”

Vernier Logo

The benefit of using this Vernier instrument or any other Vernier instruments is that student can collect and work with data that is personal to them. The number aren’t just number in a book, those numbers are the activity and the fun they had collecting them. These numbers are from real life and add an element of concreteness to something that is abstract like Math. So interpreting data becomes personal. It comes to life. Students will take a positive experience away from this Math assignment that can shape their perception and understanding of the important and usefulness of Math.

The Vernier Anemometer can be found for $89.00 along with information here: http://www.vernier.com/products/sensors/anm-bta/

The Logger Pro 3 program can be found for $249.00 along with information and deals and incentives for schools here: http://www.vernier.com/products/software/lp/

More information about Vernier products and lessons with lesson plans can be found here: http://www.vernier.com/

Example worksheet: Full of Hot Air Worksheet

CCSS.MATH.CONTENT.HSG.CO.D.12 Mystery of the Points: Finding the Euler Line

download

Every student who has passed through high school Geometry has at one point or another used a compass and a straight-edge. As anyone who has used will tell you, it gets pretty messy. The lines never exactly match up and the paper gets covered in eraser marks and holes. So why not clean it up? Geogebra is a free Geometry software similar to Geometer’s Sketchpad. The software allows the user to cleanly perform Geometric construction on a computer that are typically done with a compass and a straight edge. What makes the software so dynamic is that the drawings are 100% movable and interactive. This allows students to explore areas of Geometry that were once limited by what can be created with a compass and straight-edge.

Euler Line

A great use of this software is in lessons like “Mystery of the Points.” In this lesson students use Geogebra to explore the relationship that the Circumcenter, Orthocenter, and Centroid  have with each other. Students construct these points in the software and interact with them in ways not possible with pencil and paper. Students get to “discover” facts about these points and take ownership of their learning. When student’s take charge of their learning, there is a sense of confidence and pride in their work that can really change lives.

Beyond just lesson activities, this software can be used to make presentation pieces as well as develop graphics for worksheets. Students can even download the software at home to use on homework or to explore beyond what is taught in class. This software is an easy, fun way to integrate technology in the classroom. Students will get excited about learning and gain confidence.

Mystery of the Points Lesson Plan Mystery of the Points Worksheet

Mystery of the Points Lesson Plan

CCSS.MATH.CONTENT.HSF.BF.B.3: Using Technology to Create Discovery Based Learning in the Mathematics Classroom

Attached is an article about how FluidMath, a Windows app, can be used to promote discovery-based learning in the mathematics classroom. It is a user friendly, fun, and exciting app that encourages students to formulate hypothesis and test their ideas while receiving immediate feedback.  It is easily downloaded onto any device and with the innovation of touch screen navigation, the application is easy to use. Students can fluid mathgraph equations, factor expressions, find solutions, and much much more all with the swipe of their fingertip. Teachers can use this app as a whole class demonstration or as a small group activity to have students make up their own problems and discover the answers. At the heart of this software is the desire to have students take learning into their own hands and enjoy playing with technology while also receiving an educational benefit. However, it can also be used for a teacher-led activity where the Ipad is placed under the document camera or, if the computer is a Windows computer, a simple projector could be used to show the students what the teacher is doing from the computer. A small $1.99 subscription fee per Ipad or computer is necessary for the app to be used in addition to access to internet.

The article discusses the struggle that teachers encounter when trying to incorporate technology into the math curriculum and how using FluidMath can help to relieve some of those struggles. Within the app, there are lessons and demonstrations that use FluidMath and align with common core state standards that teachers can use in their curriculum. The specific activity discussed in the article involves dragging and dropping equations into a graph to see how constants placed throughout an equation affect the outcome of the graph.

Article and Activity:The Struggle is Real