Orthocenter! Circumcenter! Centroid! OH MY! CCSS.MATH.CONTENT.HSG.CO.D.12

Using Geogebra you can teach your high school student how to explore constructions. In this lesson, students will be given a worksheet and told to make an obtuse, acute, and right triangle of the orthocenter, centroid, circumcenter, and Euler’s line. This will let students have a chance to be creative in math. Since the student will be making their own kind of triangles. It is important to have student explore on there own to find out something and this lesson does just that. Also this lesson can lead into the history of a famous mathematician,  Leonhard Euler.

Euler line worksheet

Euler line lesson plan

HSS.ID.A.1 Turn your Students’ into Mathamagicians

FullSizeRender

Infomercial voice:

Have ever wished your students would jump up from their seats after accomplishing a task and say, “I am a genius?” Have you ever thought while teaching a student, “how can I get him to to understand? I have tried everything.” Well then. I have something for you, but first ask yourself, “what can I do to make my lessons more appealing?” Well ask and you shall receive. Introducing, GraCalc. It is an innovating and captivating calculator. How boring, you say? No Sir. This calculator is packed full of exciting ways to crank out some awesome computation. Not only does its function keys feel glassy and seamless, but you can even turn on clicking noises. ‘Click.’ ‘Click.’ ‘Click.’ This application will not leave you disappointed because with every feature comes more features! Like the Equations button.IMG_0222 
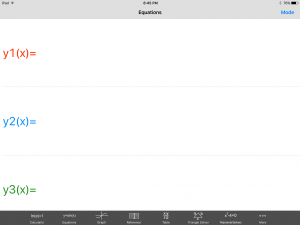
Pushing this opens a new menu that has more options in the upper right hand corner called Mode, and just wait there’s more. If you push the Mode button it opens? Yep, you guessed it, another menu with more feature! IMG_0223
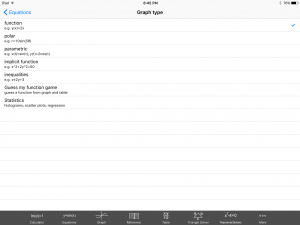
This time click the Statistics option and hear that ‘click’ sound play your favorite tune. ‘Click.’ Now don’t go away, if you place your order today we will throw in,  for absolutely free, that’s right, absolutely free data set entry into a spread sheet. Just enter your data set. Then here comes my favorite part, are your ready? Click the Histogram button at the bottom of the screen and ‘presto’, your histogram has been summoned. Turn every student in your class into a Mathamagician. That’s right! A Mathamagicaian, and bring your lessons to life. And if you order your copy of GraCalc between now and Armageddon, I’ll cut the cost in HALF. That’s right, In half. Not good enough, you say? Well finish reading this blog and I let you have the app for my famous low, low, super duper,  can’t get a better deal anywhere price of… are your ready? FREE, Yes I said it, Freeeeeeeeeeeeeeeeeeeeeeee.

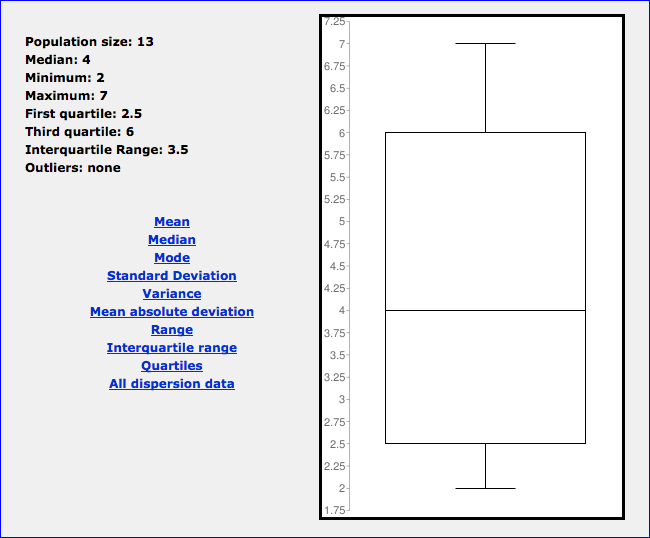
Obviously, if your still reading this blog I caught some kind of interest in you. This application that is officially called ‘Free GraCalc’ is created by William Jockusch and has many useful features. However, for the purpose of this blog I choose to talk about the statistics side of the application. Particularly, if you want to help your students understand that any data set can be put into a histogram that then can be used to interpret the data. For example, I entered a few low random numbers into the spread sheet and had the application build me a histogram. IMG_0221
IMG_0220

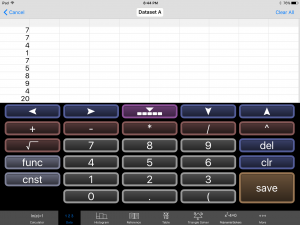
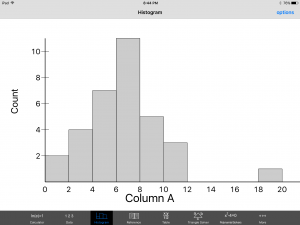
From this histogram we can make a few conclusions, one being that the entry at 20 most likely is an outlier because it is fairly far from the rest of the data. Simply put, this application puts powerful tools into the hands of your students and can truly bring your mathematics to life. It is a free application on the iPhone as well as on the iPad. I included with this post a full lesson plan to help show how a teacher could include this application as both a learning exercise on what histograms are and the information we can gather from them. Also included in my lesson plan through the class activity will be a quick easy to follow application tutorial to help introduce the students to one of the many feature this powerful app has to offer. So go fourth and teach with style. Turn every one of your students into Mathamagicians!

Common Core Standard used in lesson plan with technology in mind:

CCSS.MATH.CONTENT.HSS.ID.A.1
Represent data with plots on the real number line (dot plots, histograms, and box plots).

Lesson Plan:

Lesson Plan Histograms using Technology

Is Coke Leaving Money on the Table? CCSS.Math.Content.HSG.MG.A.1

As technology continues to grow in the world, the same can be said with the educational system. A classroom without technology has almost becoming a thing of the past. Teachers are having to adjust their classrooms and their style of teaching the younger generation that has become engulfed by technological advances. “Is Coke Leaving Money on the Table?” is a great lesson that allows for students to use computers to model soda cans to discover if Coke is using the most cost effective model. Students will be able to use the volume and surface area of a normal Coke can and their own created cans to discover a function that best relates to the radius and the surface area. This is a great way for students to explore their own curiosity of what may be the more cost efficient soda can and to find out what is the most cost efficient soda can.

Lesson Plan Modeling with Technology

Kahoot! – Using Technology to Teach Math

Cellphones, cellphones, cellphones, it seems that’s all students talk about as well as the only thing they want to be on. Well now there’s a way to integrate their love of this technology to enhance and liven up the learning environment. Let’s face it, technology isn’t going to go anywhere, in fact technology’s influence in our education system is escalating with every year, so teachers will need to learn as many ways to take advantage of the technology available to them. The attached article is all about an interactive software, Kahoot, and the many ways in which a teacher can utilize this software to spark interest and engage students. So instead of cell phones being detractors to student’s education and learning allow them to start being facilitators! student-using-smartphone-during-class_192643727

Kahoot Article

CCSS.MATH.CONTENT.HSG.GMD.A.3: Solving the Volume of 3 Dimensional Shapes Using GeoGebra Three Dimensional Graphics.

GeoGebra’s three dimensional graphics is used to assist the students in creating a visual of three dimensional models. The students will learn how to use GeoGebra and use the volume tool to calculate the volume of three dimensional objects. GeoGebra can allow the students to create their own three dimensional objects that they have created in their mind. They are allowed to rotate the object in all directions. They can calculate the volume and area of any objects. GeoGebra is used to assist the students in verifying the volume of an object.

When using the GeoGebra 3 dimensional graphics it is fairly simple to use. One must be on the Geogebra.org website. Click on “Start GeoGebra.” Then by clicking on the bottom center “3-D,” it will lead us to the 3 dimensional graphics tool. Once on the page, you will see a tool bar on the top of the page and the three dimensional axis on the right of the page. To begin with, graphing a cone will be the first step. Using the tool bar, we will scroll all the way to the left and click on the pyramid. It should look like a 3 dimensional object in the square. Then after clicking on that, we can click on the desired shape. Going to click on the cone, we then go to the three dimensional axis and click on any point where you want. Then click go up to the height you want and click on the number. Then will pop up a radius tool where you will put in the radius that is desired. Then the three dimensional object will appear on the three dimensional object. Thus, the object is created. Also, we can rotate the object to view all perspectives of the object. Any person can do this by using the Rotate 3D Graphics Tool, which is the last square in the tool box. Therefore, using the three dimensional graphics tool in GeoGebra can be used to create three dimensional objects that can help students view three dimensional object.

3 Dimensional


In the worksheet, Solving the Volume of 3 Dimensional Shapes Using GeoGebra, the worksheet is created to have the students gain the best understanding. The questions in the worksheet are scaffold from the least difficult to the most difficult such as “What is the radius and height?” and “What is the volume of the pyramid?” I wanted the questions to be worked up in the degree of difficulty so that the student can ask for help in a particular section that they are struggling in such as the order of operations when calculating the volume. I also provide a picture of the object that the students will be calculating so they can verify the shape on GeoGebra. Moreover, some students can not picture what a three dimensional object looks like so GeoGebra’s three dimensional graphics is the perfect option to help the students who are not visual learners. In addition, GeoGebra is also a perfect option for ELL learners to learn how to interpret the situation because they are able to manipulate with the three dimensional object and see how the volume increases as the object is bigger.

Below are the links to GeoGebra’s three dimensional graphics, the lesson plan, and the worksheet for this lesson.

Website: http://web.geogebra.org/

Lesson Plan: The Modeling Lesson Plan

Worksheet:Three Dimensional Shapes Worksheet

Below are images of three dimensional shapes constructed using GeoGebra’s three dimensional graphics.sphere

cone


Oh Darn! I left my tape measure at home… but it’s okay I have my math tools. CCSS.Math.Content.HSG.SRT.C.8

Modeling_picEver wonder how long your shadow was or how tall a building was? These questions are answerable without having to break out a measuring tape. You can answer these questions using trigonometric ratios and the Pythagorean Theorem.

In this lesson, students will be given real world word problems involving right triangles for which they will create mathematical models and then use trigonometric ratios and the Pythagorean Theorem to find the unknown sides and angles of the given triangle. Students will create these models by hand as well as by using GeoGebra.

GeoGebra is a free program that you can get on your computer and your tablet. GeoGebra can be used to teach and learn geometry, algebra, statistics, and calculus. It is fairly simple to use and can be used by people of all ages. In this lesson, students will be using the geometry side of GeoGebra. Students will be creating a model similar to the picture above to find the length of the new sidewalk between the Science building and the Café.

Screen Shot 2015-10-22 at 5.46.37 PM

This lesson meets the High School Geometry Common Core State Standard: CCSS.Math.Content.HSG.SRT.C.8- Use trigonometric ratios and the Pythagorean Theorem to solve right triangles in applied problems.*

Modeling using Trig Ratios and Pythagorean Theorem Lesson Plan

Modeling using Trig Ratios and Pythagorean Theorem Worksheet


CCSS.MATH.CONTENT.HSF.BF.B.3: Using Technology to Create Discovery Based Learning in the Mathematics Classroom

Attached is an article about how FluidMath, a Windows app, can be used to promote discovery-based learning in the mathematics classroom. It is a user friendly, fun, and exciting app that encourages students to formulate hypothesis and test their ideas while receiving immediate feedback.  It is easily downloaded onto any device and with the innovation of touch screen navigation, the application is easy to use. Students can fluid mathgraph equations, factor expressions, find solutions, and much much more all with the swipe of their fingertip. Teachers can use this app as a whole class demonstration or as a small group activity to have students make up their own problems and discover the answers. At the heart of this software is the desire to have students take learning into their own hands and enjoy playing with technology while also receiving an educational benefit. However, it can also be used for a teacher-led activity where the Ipad is placed under the document camera or, if the computer is a Windows computer, a simple projector could be used to show the students what the teacher is doing from the computer. A small $1.99 subscription fee per Ipad or computer is necessary for the app to be used in addition to access to internet.

The article discusses the struggle that teachers encounter when trying to incorporate technology into the math curriculum and how using FluidMath can help to relieve some of those struggles. Within the app, there are lessons and demonstrations that use FluidMath and align with common core state standards that teachers can use in their curriculum. The specific activity discussed in the article involves dragging and dropping equations into a graph to see how constants placed throughout an equation affect the outcome of the graph.

Article and Activity:The Struggle is Real


CCSS.MATH.CONTENT.HSS.ID.A.1: Using Alcula to create a Box and Whisker Plots

Screen Shot 2015-10-20 at 4.10.50 PM

Attached is an article about Alcula, a website that can be used to create box and whisker plots. This website is an easy, accessible tool that empowers students to understand box and whisker plots on a deeper level. Students can check their mathematical understanding by using Alcula to verify their answers for the 5 number summary of a given data set and the box and whisker plots they have created by hand.

Teachers can use this website during an entry task and have students determine the 5 number summary for a given box and whisker plot. Teachers can have their students use this website individually or in small groups. Teachers can also use Alcula to give the students a visual representation of test results and grades. Alcula can be used on a computer, smart phone, or tablet that has internet access.

Using Alcula in the Classroom Article

Learning Progression for Polynomial Arithmetic (A-APR)

This learning progression covers the arithmetic involved with polynomials, mainly focusing on quadratics. Also attached with the learning progression is a lesson plan that highlights the formative assessments associated with this learning progression. Students will participate any numerous cooperative learning activities as well as be given the opportunity to show their understanding of the concepts to the rest of the class by demonstrating their work on the board. These lessons are engaging and informative for students who need to meet the following Common Core State Standards:

  • CCSS.MATH.CONTENT.HSA.APR.A.1
  • CCSS.MATH.CONTENT.HSA.APR.B.2
  • CCSS.MATH.CONTENT.HSA.APR.B.3
  • CCSS.MATH.CONTENT.HSA.APR.C.4
  • CCSS.MATH.CONTENT.HSA.APR.C.5

Here is the learning progression and the lesson plan:
Learning Progression
Lesson Plan

3-Acts Math Task: Shower v. Bath

The Shower v Bath activity from Dan Myers’s Three-Acts Math tasks is about which one is cheaper, a shower or a bath. The first video shows a person taking a shower and a person taking a bath in order to set up the scenario. Then in part two it shows two videos, one showing the duration of the bath and shower, and one showing the time it takes to fill up to a gallon of water for both. Also in act two It tells you the cost of water in Mountain View, CA. In the last act the students answer questions based on the information they are provided. They have to figure out which one is cheaper, how long of a shower would they have to take to equal the same amount of water as a bath, and they will have to compare with their classmates.

http://mrmeyer.com/threeacts/showervbath/

The common core state standard for this activity is:

CCSS.MATH.CONTENT.6.RP.A.3
Use ratio and rate reasoning to solve real-world and mathematical problems, e.g., by reasoning about tables of equivalent ratios, tape diagrams, double number line diagrams, or equations.

To achieve the common core standard I would fist show my students the fist video of the person showering and taking a bath. I would then ask my students to predict what they thought the cheaper option was and why. This will get my students thinking about the problem of which option uses more water and which option is more expensive. Next I would ask my students what information they needed to solve the problem. After discussing this and coming to an answer I will then show my students the other two videos about the duration of the shower/bath and the water rate in minutes per gallon. This will help students reason and problem solve about a real world situation using mathematics.

Question 3-6 will be a good formative assessment to see if my students have achieved the learning target. These questions will get my students thinking and using their mathematical reasoning about this real world situation. The last question asks students to compare their data with their classmates. This will get my students creating charts, diagrams, averages, and generalizing the whole real world situation. This question will help show me that my students have met the learning target.