Paper Bridges
Standard: CCSS 8.EE.B.5 MP 4
By: Naomi Johnson, Rachel Van Kopp, Tracy Van Lone, Natasha Smith, and Kimberly Younger
Problem
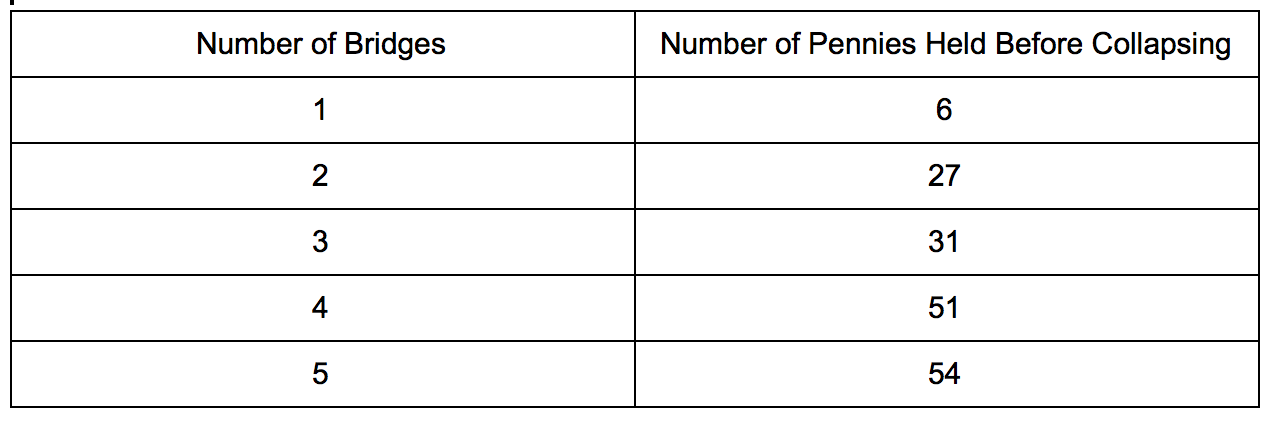
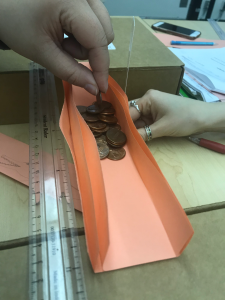
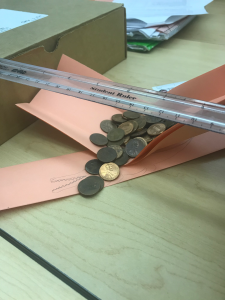
Paper Bridges is looking at the correlation between the number of pennies that a number of paper bridges could hold. To find this, we folded pieces of paper that were all the same size in the same way. We then put one paper, folded as a bridge, on two equal size books, an inch of paper was on each book. We then placed pennies on the bridge until it caved in 1/8 of an inch or collapsed, whichever came first. We then counted the pennies and recorded the number.
We repeated these steps with 2, 3, 4, and 5 paper bridges laying on top of each other to see how more paper effected the number of pennies that were able to be help.
Analysis
Table 1: Data collected from our experiment.

To analyze our data, we inputted the data from Table 1 into our calculators. We performed a linear regression on the data as well as an exponential regression. We were given the following equations:
Linear Equation: y = 12x – 2.2
Exponential Equation: y = 5.9259 * 1.6537^x
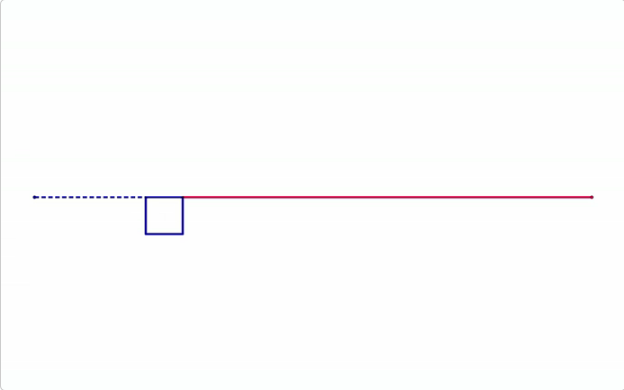
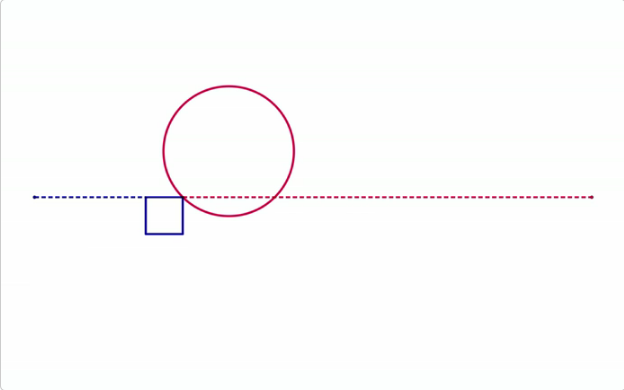
We plotted all our data and graphed our equations. Figure 1 shows what this looked like.
Figure 1: Our data plotted with our two equations. The red line represents the linear equation and the blue line represents the exponential equation.
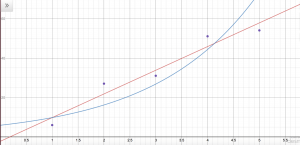
After looking over Figure 1, we had a hard time determining which equation did a better job of representing our data. Neither line was incredibly close or far away from the points. At this point in time, we believed both equations could possibly be good representations of the data.
We decided to find the absolute value of the difference between each data point and their expected linear and exponential value. We then averaged the differences. Table 2 shows what we found.
Table 2: The absolute value of the difference between each data point and their expected linear and exponential value. In the bottom line is the average of the differences.
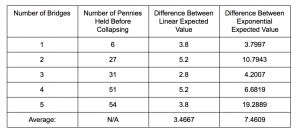
We were than able to see that the linear equation seemed to better match our data. All the linear differences compared to the exponential differences were smaller expect for with the first data point. The average exponential difference was more than two times the average linear difference. It appeared that the exponential equation could be growing too fast.
While we may have found reason to believe the linear equation was the better fit, we still felt like we needed more data. When doing this activity in a classroom, we would recommend extending the domain and creating more data points. We would also recommend having students do multiple trials of the experiment or having students share their data with the class.
Extension
A lot of variables come into play when a structure collapses. For instance, our paper bridges collapse as more and more pennies are placed in the middle. Interestingly, even though all groups of students involved in the investigation in our class used the same paper, folded the same way, and collapsed their bridges with pennies weighing exactly the same amount, no two teams’ bridges collapsed under the same number of pennies. Some teams gently “placed” their coins on their bridges, enabling their bridge to hold more weight than the teams that “dropped” their coins on the bridges. Some teams spread their coins a bit wider along the center of their bridge than others, enabling more coins to stack up on their bridge prior to its collapse. Other teams folded their bridge papers more sharply and precisely, causing the structure to be more rigid. Many variables add up to change the dynamics from one bridge to another despite seemingly identical bridge designs and project execution instructions.
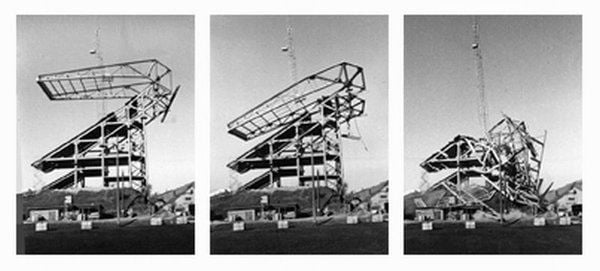
A real-life structural collapse occurred on 1987 when UW built an addition to Husky Stadium. Nine temporary guy wires were holding the stadium roof up while additional structure was built underneath. The stadium was well designed and should not have collapsed. But a collection of variables added up to change the dynamics from the stadium addition as designed to the stadium addition as executed. Construction specifications were not very specific about when the appropriate time would be to remove the temporary guy wires and how many should be removed at a time. Ask students to read these articles and identify the variables they see impacting the collapse. Would the structure have stood if only 5 guy wires had been cut? What if only 4 guy wires were cut and the hollow steel tubular beams had been filled with concrete as specified by the designer? Would the stadium have stood? What about the cat?
Husky Stadium history
Husky Stadium Failures
SaveSave
SaveSave
SaveSave
SaveSave
SaveSave
SaveSaveSaveSave