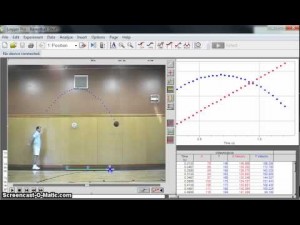
Have you ever had a difficult time finding a math project that is both engaging for students and involves technology? Vernier products are wonderful tools for projects such as these, that can be very difficult to implement in the classroom. However, with these tools there are infinite possibilities for engaging projects. One product that is popular is called Logger Pro. This software allows students to take videos of any motion or movement and upload those videos to Logger Pro. Logger Pro can then plot those motions in relation to both the x and y axis, and allow students to find regression lines through the data points. This software is a way for students to be creative and see the connections between the math that they are using and the real world. For more information about Logger Pro, visit: http://www.vernier.com/products/software/lp/
An example of a great project for students to do with this Logger Pro Software is a project where students get into groups, film each other throwing a ball back and forth with different speeds and different heights, create the plot points of the movements on Logger Pro, find the regression equations of those points in relation to the x and y-axis, and then analyze the differences between the throws and their relationship to the matching graphs.
For this project, students will need some extra materials such as a video camera (can use phone), a ball of their choosing, and Logger Pro.
The standards that align with this project are:
Compare properties of two functions each represented in a different way (algebraically, graphically, numerically in tables, or by verbal descriptions). For example, given a linear function represented by a table of values and a linear function represented by an algebraic expression, determine which function has the greater rate of change.
Describe qualitatively the functional relationship between two quantities by analyzing a graph (e.g., where the function is increasing or decreasing, linear or nonlinear). Sketch a graph that exhibits the qualitative features of a function that has been described verbally.
This activity should be used in math classes because it shows students that math is involved with the real world and can be applied to their interests and things they are familiar with such as sports. It also allows students to be able to work in groups, can be adjusted to fit the community, students’ experiences, or interests since they can throw balls of varying types. The technology of Logger Pro also exposes students to the use of technology to solve math problems. In this case, students will be using technology of video cameras to record the throws, computers to access Logger Pro, and the software of Logger Pro. This activity is additionally a way to enhance teaching of common core standards for mathematics because it gets students physically, technologically, and mentally involved with math, by relating math to what they are familiar with like throwing a ball, and is a way to get students away from direct instruction.
To see the work sheet corresponding to this activity, go to the link below:
throwing-a-ball-project-directions


