Solving Linear Systems of Equations: HSA.REI.C.5 and HSA.REI.C.6

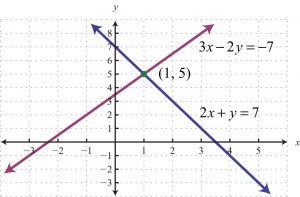
This learning progression was created for a 9th grade Algebra 1 class. It is supported by the textbook, “Algebra 1: Applications, Equations, Graphs,” by Larson, Boswell, Kanold, and Stiff. The progression follows chapter 7, sections 1-3 in the text. The main focus of this progression is to teach students how to solve systems of linear equations by graphing, substitution, and combination.

Common Core State Standard:

CCSS.MATH.CONTENT.HSA.REI.C.5: Prove that, given a system of two equations in two variables, replacing one equation by the sum of that equation and a multiple of the other produces a system with the same solutions.

CCSS.MATH.CONTENT.HSA.REI.C.6: Solve systems of linear equations exactly and approximately (e.g., with graphs), focusing on pairs of linear equations in two variables.

Common Core Mathematical Practices:

MP1: Make sense of problems and persevere in solving them

MP2: Reason abstractly and quantitatively

MP6: Practice attention to precision


Learning Progression Systems

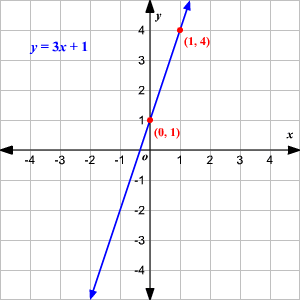
HSA.CED.A.2: Creating Linear Equations

This learning progression was created for a 9th grade Algebra 1 class. It is supported by the textbook, “Algebra 1: Applications, Equations, Graphs,” by Larson, Boswell, Kanold, and Stiff. The progression follows information in the textbook, but not necessarily in the order that the book presents it. The main focus of this progression is to teach students how to first create a linear equation from a graph, then create a graph from a linear equation, and finally create equations and graphs from story problems.

Common Core State Standard:

CCSS.MATH.CONTENT.HSA.CED.A.2: create equations in two or more variables to represent relationships between quantities; graph equations on coordinate axes with labels and scales.

Common Core Mathematical Practices:

MP2-Reason abstractly and quantitatively

MP3-Construct a viable argument and critique the reasoning of others

MP4-Model with mathematics

Learning Progression 1 PDF

Frisbee and Distance Problem HSG.SRT.C.6

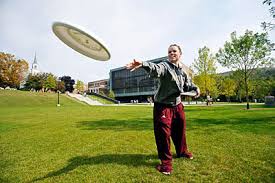
frisbee-picture

It can be difficult to create an interesting math problem that engages students. One way to grab students’ attention right from the start is to incorporate a relatable picture into the math problem. For instance, the picture above. Many math problems can be inspired by this image, but one problem in particular is a trigonometry problem involving a right triangle created from throwing the Frisbee.

An example of this problem could be:

Imagine you are throwing a Frisbee to a friend. If you throw the Frisbee linearly, at a 12-degree angle, and the Frisbee is 10ft. directly above your friend’s head, how far away are you from your friend?

For this problem, students would be using their problem solving skills and the concept of trigonometry, to relate the given side lengths and degrees. The students will have to go through the process of creating a diagram or visual of the triangle being discussed, decide how the picture will look, and where the information should be placed. Once the diagram is complete, students must have the right angle placed at the friend, with the 10ft. marked as the leg above that friend, and the 12-degree angle placed at the student. After this, the student must use algebra to complete the problem and find the distance between the student and their friend. Therefore, this problem is comparable to any simple trigonometry problem. However, if the students begin by looking at this picture and imagining doing the activity of throwing a Frisbee to their friend, then the problem will become much more engaging and relatable.

The Common Core State Standard that this problem teaches is:

CCSS.MATH.CONTENT.HSG.SRT.C.6

Understand that by similarity, side ratios in right triangles are properties of the angles in the triangle, leading to definitions of trigonometric ratios for acute angles.


Logger Pro Ball Throwing Project CCSS 8.F.A.2

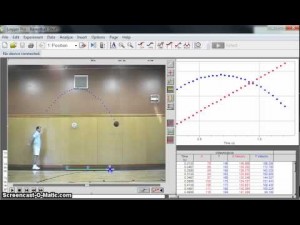
Have you ever had a difficult time finding a math project that is both engaging for students and involves technology? Vernier products are wonderful tools for projects such as these, that can be very difficult to implement in the classroom. However, with these tools there are infinite possibilities for engaging projects. One product that is popular is called Logger Pro. This software allows students to take videos of any motion or movement and upload those videos to Logger Pro. Logger Pro can then plot those motions in relation to both the x and y axis, and allow students to find regression lines through the data points. This software is a way for students to be creative and see the connections between the math that they are using and the real world. For more information about Logger Pro, visit: http://www.vernier.com/products/software/lp/
 

logger-pro-picture-example

An example of a great project for students to do with this Logger Pro Software is a project where students get into groups, film each other throwing a ball back and forth with different speeds and different heights, create the plot points of the movements on Logger Pro, find the regression equations of those points in relation to the x and y-axis, and then analyze the differences between the throws and their relationship to the matching graphs.


sports-balls

For this project, students will need some extra materials such as a video camera (can use phone), a ball of their choosing, and Logger Pro.

The standards that align with this project are:

CCSS.MATH.CONTENT.8.F.A.2

Compare properties of two functions each represented in a different way (algebraically, graphically, numerically in tables, or by verbal descriptions). For example, given a linear function represented by a table of values and a linear function represented by an algebraic expression, determine which function has the greater rate of change.

CCSS.MATH.CONTENT.8.F.B.5

Describe qualitatively the functional relationship between two quantities by analyzing a graph (e.g., where the function is increasing or decreasing, linear or nonlinear). Sketch a graph that exhibits the qualitative features of a function that has been described verbally.

throwing-a-ball


This activity should be used in math classes because it shows students that math is involved with the real world and can be applied to their interests and things they are familiar with such as sports. It also allows students to be able to work in groups, can be adjusted to fit the community, students’ experiences, or interests since they can throw balls of varying types. The technology of Logger Pro also exposes students to the use of technology to solve math problems. In this case, students will be using technology of video cameras to record the throws, computers to access Logger Pro, and the software of Logger Pro. This activity is additionally a way to enhance teaching of common core standards for mathematics because it gets students physically, technologically, and mentally involved with math, by relating math to what they are familiar with like throwing a ball, and is a way to get students away from direct instruction.

To see the work sheet corresponding to this activity, go to the link below:

throwing-a-ball-project-directions


Student-Applicable Modeling Lesson HSS.ID.6.A

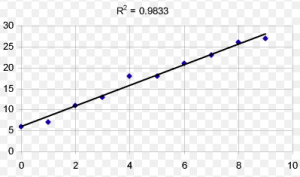
screen-shot-2016-10-25-at-11-11-27-am

This lesson is focussed on having students find a regression to best fit a set of data of homework scores and test scores of pervious years. This lesson requires students to focus on modeling their findings graphically, use technology of an advanced graphing calculator, and answer prompts to promote deeper thinking of their findings.

To view this lesson, click the link below:

homework-and-test-score-correlation-lesson


Desmos: Graphing Calculator for All

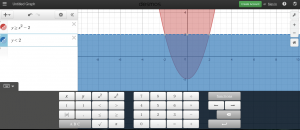
desmos-thing

Desmos is a wonderful tool for education. It creates an atmosphere of learning for all types of student whether they be visual, auditory, or kinesthetic learners. It is an especially good program for helping students to understand inequalities. To see more information on a lesson involving Desmos (a free technology) and how it can be used to help students understand inequalities, click on the link below.

desmos-article