By: Kimberly Younger
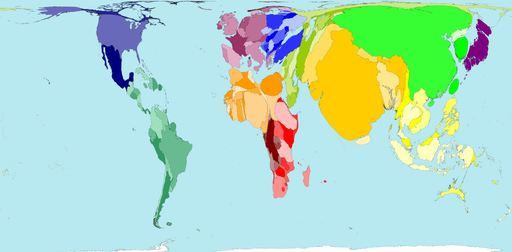
This image of the world, from World Mapper is skewed based off the current population in each country. Students will be assigned a country and will be asked to find out the population of the country in 1918 and the current population (2018) then they will compare the the change in population.
The lesson will focus on the standard CCSS.Math.Content.8.F.B.5 which is finding the functional relationship between two quantities, whether they are increasing or decreasing and for the this lesson they would be focusing on only linear functions. The lesson will be called Population Change Project, students will sketch the graph with the population data they collect and write a paragraph about the data the collect and interpret what it means. Including information about why they think the population increased or decreased.
This Lesson is culturally responsive because students will be learning about other countries and why the population may have increased or decreased over decade (1918 – 2018). Students could be supplied with websites which show the current population and the passed population or they can be given time to do the research on their own.
The students will use the mathematical practice of CCSS.Math.Practice.MP1 which focuses on students problem solve and preserve in solving math problems. CCSS.ELA-Literacy.L.8.3 is the use knowledge of language and its conventions when writing. The evidence of this standard would be found when students complete their write up about the change in population over the passed decade.
Kimberly,
This is a wonderful lesson idea to go along with a very intriguing picture! This picture is an excellent way to bring in culture to the math classroom. A slightly different way you could approach this picture is to focus on ratios and proportions instead of linear functions. Students can be asked to compare the populations of different countries to one another. For example, for every 3 people living in America there are 7 people living in China.
To take this idea a step further, ask students to describe the population of one country as a percent of the entire population in the world! For example, “The people in Russia represent about 22% of the people in the entire world.”
CCSS.MATH.CONTENT.6.RP.A.3.C
Find a percent of a quantity as a rate per 100 (e.g., 30% of a quantity means 30/100 times the quantity); solve problems involving finding the whole, given a part and the percent.
CCSS.MATH.CONTENT.6.RP.A.1
Understand the concept of a ratio and use ratio language to describe a ratio relationship between two quantities
-Bailey Martoncik