This learning progression is based on the students being able find the slopes of lines and determine if two lines are parallel or perpendicular based on their slopes. It a compilation of three math tasks that will help students understand how to find the slope of a line, classify lines as parallel or perpendicular, and writing equations in slope intercept and point slope forms.
Students will use the slope formula to find the slope a line that is graphed as well as find the slope of a line when two points for a line are given.
- MATH.CONTENT.HSG.GPE.B.5– Prove the slope criteria for parallel and perpendicular lines and use them to solve geometric problems (e.g., find the equation of a line parallel or perpendicular to a given line that passes through a given point).
Students will be using the slopes of two different lines to determine if they are parallel or perpendicular. They will recognize that parallel lines have the same slope and slopes for perpendicular lines are opposite reciprocals.
- MATH.CONTENT.HSG.CO.C.9– Prove theorems about lines and angles.
Students will learn to write equations in point slope form and slope intercept form. They will use the information from these equations, as well as knowledge from the previous tasks to graph lines.
- MATH.CONTENT.HSS.ID.C.7– Interpret the slope (rate of change) and the intercept (constant term) of a linear model in the context of the data.
Formative assessment in the form of observation and discussion will be the primary procedure to support student learning. I will observe how they are finding solutions and ask them questions about their understanding of the learning targets. At the end of each task students will be given a handout, which will also show how well they are able to meet the learning targets.
Slopes of Parallel and Perpendicular Lines Learning Progression

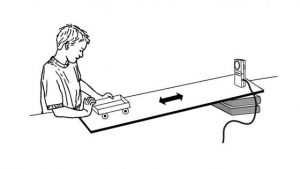 Students can get easily confused when it comes to understanding variables of a graph and visualizing what that information represents. This activity will allow students to see how the path of an object moving toward and away from a given point is modeled. With the use of their TI-84 Plus graphing calculators and the Vernier CBR-2, students in small groups will study the motion of a tennis ball and a toy car rolling up and then back down a ramp. This gives them an opportunity to practice interpreting the motion of the objects through a hands on activity.
 The graphs for the motion of either object should be similar in that they are parabolas, but students will be able to see what determines their properties. At first, they will be asked to visualize and sketch what they imagine the graphs would like. Then by using the technology explained, they can see how their original assumptions compare to the graphs obtained from the motion detector. This will encourage students to critically think about an object in motion and have a better understanding of how its distance from the starting point in relation to time is represented.