7-RP Learning Progression for ratio and proportional relationship with real world applications

Pizza
unit_rate
Attached is a learning progression about the ratio and proportional relationship CCSS.MATH.CONTENT.7.R.P. students expand upon their previous knowledge about ratios and develop an understanding of proportional relationships. Students use ratios to represent real world scenarios and compute unit rates in order to compare ratios with the same units. They use equations to represent and analyze proportional relationships. They also must be able to graphically represent proportional relationships and explain what each coordinate on the graph represents in terms of the scenario. Students will also have to solve multi-step ratio and percent problems. By the end of this unit students will be able to solve problems involving discounts, taxes, percentage increase and decrease, and use scale models. Throughout the learning progression there are multiple mathematical practices and visual representations to aid students with learning disabilities and different learning styles to help them achieve mathematical understanding regarding ratios and proportions.

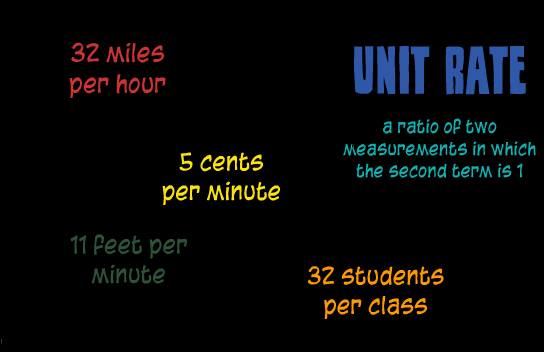
Along with the learning progression is an kinesthetic activity that engages students in practical applications of unit rates. The problem, “A pizza with 8 slices evenly proportioned cost $14.80, what is the cost of each slice of pizza?” Will be used as the real-world situation to find the unit rate, make a table and graph to represent the data, and as information for an equation to represent the proportional relationship. Each student will make their own pizza with 8 slices evenly proportioned. Students will need to remember unit rate definition to find the unit rate and write the unit rate on each slice of pizza. Using Geogebra students will be asked to make a table and graph to represent their data. Students will be formatively assessed throughout the lesson to provide evidence to provide feedback about whether students are ready or not for the benchmark assessment that will be given the following day testing the standards gone over in this lesson. Students order pizzas and other take out food, so being able to solve this problem will be useful for them to figure out how to save money and get the better deal when ordering food. If some students do not like pizza you could give them a different type of food to peak all students interests and make it relatable to them and increase the diversity of curriculum in the classroom.
LP and lesson plan

A-CED Falling Glowsticks

The Falling Glow Stick activity from Dan Meyer’s Three-Acts Math tasks , shows two video clips. The first video clip is from a movie where they drop a glow stick into a chasm to see how deep it is. And the second video reveals how the estimated height they arrived at, given the amount of seconds it took for the glow stick to reach the bottom. The activity can be found at the following website:
http://mrmeyer.com/threeacts/fallingglowsticks/

This activity address common core high school Algebra standard A-CED:
Creating equations that describe numbers or relationships.
Specifically this problem uses standard 2 of A-CED:
Create equations in two or more variables to represent relationships between quantities; graph equations on coordinate axes with labels and scales.

To have students accomplish learning objectives in this standard, I would personally show students video one. I would proceed by having them estimate a guess and an interval for their guess: stating a height that is too high and a height that is too low.
To build upon their previous knowledge I would have students turn to their peers and collaborate about what variables and factors affect deriving the height of the chasm. I would walk around and prompt the students to use mathematical terminology such as rate, time, and distance.
Once finished with brainstorming and discussing with their peers, I would then challenge the students by having them build an equation on their own using the variables and factors from their discussion and encourage them to use their estimated interval to check their equation.
I would then show the second video where the solution is revealed. I would have the students check their solution and revise their equation based on the known variables if needed. During this time I will be walking around the room and formally assessing if students were able to create an equation that accurately expressed the relationship between the variables. If enough students grasp the concept, then I would have the class reflect upon their equation and ask them the last question given on Dan Meyer’s activity: if you drop a rock off of the Golden Gate Bridge, how long will it take for you to hear a splash? This will ensure that students have a general solution they can apply to other real world situations. If the students were struggling I would have a few students who had a good grasp of the activity explain their findings to the class. Based on their input, as a class, we would derive an equation together through guided instruction. The students would be able to use the answer from the second video to check their progress and accuracy of the equation. Once all students have a valid equation, I will proceed to ask them the question posed by Dan Meyer’s as previously mentioned.
To wrap up the activity I would have the students again gather in groups to compare their equations. For their benchmark assessment, as a group they must come to a consensus the best equation and graph the equation they agreed derived the most accurate solutions. The graphs must be scaled correctly with accurate units and axis. The students must present their graphs to the class and explain why their equation graph is valid and justify how it can be used in real world scenarios. On the back of the graph I would have the students write their equation and write their explanation and justification.

6.EE – Healthy Heart

Students these days tend to lack exercise due to the constant use of technology. This real world problem engages students in a fun math activity that combines the use of technology with exercising. By monitoring their own heart rate students will have the opportunity to analyze the relationship between the dependent variable and the independent variables using graphs and tables, and relate these to equations that represent data applicable to real world problems.
On the livestrong.com website, Sarah Dray(2013) claims “Once you stop your workout, your heart rate should drop by about 20 beats during the first minute. People who have a reduction of 12 or less during that first minute are at a higher risk of suffering a heart attack later in life.” Are you at risk of suffering a heart attack later in life?

To have students answer this question they will need to monitor how fast their heart rate returns to normal after exercise with Vernier heart rate monitors and TI-84 graphing calculators.

http://www.vernier.com/products/sensors/hgh-bta/
As a class decide what type of exercise the students would like to partake in?(bunny hops, umping jacks, jogging in place, etc.)
After demonstrating how to use the technology. Have students break up into groups of four. The students should rotate taking turns monitoring their heart rate.
Students will see if their heart is in a health state by starting at rest, exercising for a minute, and then stopping and letting their heart return back to normal. Students will collect data of their heart rate every 10 seconds for the 2 minute period.
The common core standard of focus:
CSSI 6.EE.9 Use variable to represent two quantities in a real-world problem that change in relationship to one another; write an equation to express one quantity, thought of as the dependent variable, in terms of the other quantity, thought of as the independent variable. Analyze the relationship between the dependent variable and the independent variables using graphs and tables, and relate these to the equation.
To achieve the standard above have students make a table and graph of their data collected. Then with guided instruction have them write two equations. One equation reflecting how fast the heart rate accelerate during exercise and another equation reflecting how quickly the heart rate slowed during recovery.
To guide the student through the activity use the student handout attached and have the students fill out the handout as a group. By collaborating in groups they can learn how to respect each others thoughts and ideas, preparing them to be responsible citizens in a diverse society.
After the activity encourage students to bring their parents in during recess or lunch hour during the following day. Students can teach their parents how to use the equipment and test their parents heart health by monitoring the rate the parents’ heart recovers after a period of exercise.

Student Handout:
1. What is the independent variable?
2. What are the units of the independent variable?
3. What is the dependent variable?
4. What are the units of the dependent varibable?
5. What type of slope occurs when you begin to excersise?
6. What type of slope occurs when you let your heart rate return to its resting state?
7. What type of slope occurs if you just remain still.
Fill out the Table representing your heart rate. Make sure to include units
Time Heart Rate

Graph the the information on your table. Make sure to label your axis.

8. Write one equation reflecting how fast the heart rate acclerated during exercise.

9. Write a second equation reflecting how quickly the heart rate slowed during recovery.

10. Based on your data are you at risk of suffering a heart attack later in life? Explain.

8.G Applying the Pythagorean Theorem in Two Dimensional, Real Life Scenario

This assessment problem has students apply the Pythagorean Theorem in a real life scenario that is applicable to them. It requires students to find distances from one point of interests to the next, such as school or the movies. Students must find the distance of different locations that represent the legs or the hypotenuse of a right triangle.
The problem is aligned to common core standard 8.G.7:
Apply the Pythagorean Theorem to determine unknown side lengths in right triangles in real-world and mathematical problems in two and three dimensions.
However this specific assessment only evaluates students capability of solving two dimensional real world problems.
Applying the Pythagorean Theorem

F.FT-A Picture to Model Periodic Phenomena

ferris wheel

This Ferris wheel has a diameter of 50 meters and rotates once every 5 minutes. The axle of the Ferris wheel is 30 meters from the ground. Sketch a graph to show how the height of a passenger will change with time. Find the minimum value, maximum value, and amplitude of your graph. Furthermore derive a function to model this scenario.


Aligns to Common Core Standard F-TF Trigonometric Functions:


Model Periodic Phenomena with trigonometric functions


5. Choose trigonometric functions to model periodic phenomena with specified amplitude, frequency, and midline.


8.EE-Technology and Modeling Lessons that Enhance Student Learning

Driving to the Movies

Main-AB-Touch-ActivInspire-5-Stu

99% of the time teenagers’ favorite thing is friends and social life. This activity takes a normal social outing like going to the movies and helps students make sense of the problem from a mathematical perspective. The lesson is about relating cars speed to linear equations and finding the solutions of intersecting lines. In groups students will have to use knows and unknowns to make a model on ActivBoard Touch, which will appeal to kinesthetic and visual learners. The ActivBoard touch is like an interactive white board that serves as a collaboration zone for up to six students at a time.  Students use the model to solve the problem and see how changing different variables will affect the solution. Using a model to represent mathematics brings learning to life and increases student engagement. Students will feel empowered by being able to evaluate their own solution by physically seeing if their algebraic solution matches the graph solution represented in the model. I believe this lesson will effectively engage students in inquiry based learning since the scenario is relatable to their everyday lives. The Activboard Touch allows students to stimulate senses in the classroom that are usually kept lock away. This lesson allows students to visually see, engage, and then respond while effectively communicating with peers.

lesson plan for car problem cars worksheet

To hear case studies and success stories regarding using Activboard Touch to enhance student learning view this link:

http://www.prometheanworld.com/us/english/education/research/case-studies/#

To see how ActivBoard and how it can be used visit this link:

http://www.prometheanworld.com/us/english/education/products/interactive-whiteboard-systems/activboard-touch/

G.MG-Using SketchUp for Explaining Area and Surface Area

Attached is an article explaining how SketchUp software can be used to create 3D visual representations of modeling problems. By being able to design their own house and complete the attached worksheet (with given dimensions), students are demonstrating their mathematical understanding of: how to calculate the individual areas of the house components and total surface of area of the house. Teachers can use this software as a teaching tool by allowing students to create a house of their own design, but then, by having all students use the same, given dimensions, students are able to calculate the individual areas of the geometric shapes on the house and the total surface area of the house with a worked solution. Teachers can then build upon this previous lesson by requiring students to create their own design and having students to calculate their own individual areas and surface area of their design. The SketchUp software can be used to improve students’ curiosity of mathematics’ applicability to real-world situations and create a desire to continue learning mathematics.

Teachers can use this software for whole class discussions to give students a visual representation of the mathematical concept being analyzed. This software can also be used for individual or group student projects and activities. Students have the opportunity to use their creativity and kinesthetic learning styles to explore concepts such as, geometric figures, area, volume, midpoint, distances, and real world scenarios such as landscape design problems. There are two versions of SketchUp: there is the SketchUp Pro software, which requires a Statewide K-12 License Grant to access, but after a license is obtained, it is accessible to public K-12 schools at no cost. Then, there is the SketchUp Makes software, which is free to public and does not require a license.

technology article