Alex Heide, Brittany Moore, Nina Flanagan, Peyton Tamoyo
Desmos is a fully interactive mathematical tool that can be used for multiple concepts that allows for the students to be in complete control of their own curiosity.
What does Desmos do?
The ability to manipulate functions through graphs and tables is an important concept that allows for the students to visualize and to bring life the mathematical world that ranges from the lower levels of algebra to as high as advanced calculus and statistics. This application that is available on computers, tablets, and smartphones that can range from multiple Common Core State Standards that can be applied in multiple lessons within the classroom.
Built In Lessons
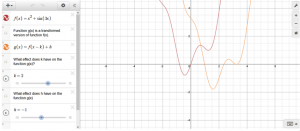
Desmos has 30+ built in lesson examples. In a specific lesson on function transformations, Desmos allows for the students to use sliders, a tool to switch between values interchangeably, to have power over what a variable will do to general function graphically. The slider tool is a unique characteristic of the program which enables students to input a general function such as a parabolic with scaler that you can hit play to animate the graph by changing the value of said scaler. The table option also give students another representation that gives specific coordinate points that can be useful for certain students’ learning needs. Students will be able to use visual representation to help guide them to understand how a scaler or scalers can alter the appearance of the function graphically.
Desmos helps to address student’s misconceptions of any math topics by allowing students to interactively change and manipulate the graph in real time. They can even press play on the sliders to allow the graph to continually for students to observe what happens for each variable.
Classrooom Example
Desmos can aid in a lesson on transformations that addresses the Common Core State Standard CCSS.Math.Content.HSF.BF.B.3, where students build new functions from existing functions. This standard requires that students, “Identify the effect on the graph of replacing f(x) by f(x) + k, k f(x), f(kx), and f(x + k) for specific values of k.” Desmos will allow for students to use the sliders for each transformation case. This way the students will be in control of their own hypotheses on how the values of k will graphically manipulate the original function. For example, the teacher can ask the class what happens to the original function when we change the value of k? Students would be able to change the value of K using the slider and then come to the conclusion that k moves the function left and right. The teacher could also ask students to show a function that is translated up 5 and to the right 3. Students can do this in the calculator and physically show their work or save the graph to turn in later. Desmos has a pre-set example of a transformation and function that students can also use to adjust the sliders. This function can also be altered to any general function that is more applicable to the classroom’s knowledge.
Desmos is a very interactive application that can be used in many facets of the classroom to enable and enhance student learning. This application is versatile and creates options for the teachers to project it from computers for a lesson or allow the students to work independently and/or collectively to generate their own conclusions. Desmos is very intuitive and user-friendly that it can be integrated into any classroom that will allow you to scaffold consecutive mathematical concepts and lessons.
Download the article Here: Desmos