7.G.B.6 Model this!

Studio 360 adds walls of modular shelving and storage to Slovenian apartment

Can you identify the basic geometric shapes in this living room? Given edge length measurements, can you find the area of the block panels, the approximate volume of the couch, or the surface area of the coffee table? To do this, you need spatial visualization skills and modeling skills. These are very important skills that students will need to develop in order to interpret and describe physical environments for solving tasks in everyday life.

The main idea of this lesson progression, intended for a high school Geometry class, is for students to develop spatial visualization and modeling skills to solve problems with real-world, 3-dimensional figures. It consists of three separate lessons, a formative assessment in between the lessons, and a summative assessment at the end of the sequence. The lessons gradually teach students the necessary foundational skills, from visualizing 2D and 3D figures as a composition of basic rectangles and triangles, to calculating the area, surface area, and volume of the figures. The assessments will provide the necessary feedback for both the students and teacher to determine what students know and need to review in order to reach the CCSS-Math standards aligned to this lesson progression.

3-Acts Math Task: 8.G.7 Taco Cart

The 3-acts math task, “Taco Cart,” by Dan Meyer can be found at http://threeacts.mrmeyer.com/tacocart/

and is aligned to

  • CCSS-Math 8.G.7 Apply the Pythagorean Theorem to determine unknown side lengths in right triangles in real-world and mathematical problems in two and three dimensions,
  • CCSS-MATH F-IF.4 For a function that models a relationship between two quantities, interpret key features of graphs and tables in terms of the quantities, and sketch graphs showing key features given a verbal description of the relationship.
  • CCSS-Math MP.4 Model everyday problems with mathematics.

The first act shows a video introduces the problem which is that Dan and Ben are on the beach when they notice a taco cart on the street. Ben wants to walk straight over (through the sand) and Dan wants to walk toward the street and then straight to the taco car down the street because they walk a lot slower on the sand, so they go their separate ways. The second act provides pictures of the path Ben and Dan each take with the dimensions as well as the walking speed on the sand and the walking speed on the street. The third act is a video of Ben and Dan each walking along their separate path toward the taco cart. This video shows that Dan did reach the taco cart before Ben.

Taco Cart requires the use of the Pythagorean Theorem to find out who will get to the taco cart first if two people that start at the same point take a different path (each at a different speed). I would use this activity to teach the CCSS-Math 8.G.7 because the paths taken by each of the two people form a right triangle, so students would have to find the length from the starting point to the destination point, the taco cart. The path that the first person takes is the hypotenuse of the right triangle. The path the second person takes is the adjacent and opposite side, so the distance the second person will walk is the adjacent side + the opposite side. In other words, the paths serve as a real-world version of the side length of a right triangle. This activity could be used to teach the CCSS-Math F-IF.4 because the different paths that each of the two people take represent quantities that will be interpreted. Other quantities which are part of this task and need to be solved for are the distance/dimensions (side length of the right triangle) and the speed at which the two people walk (since one walks on sand the entire time and the other on a sidewalk). The distance/dimension and the speed are important factors that will help the student interpret the answer. Lastly, this activity could be used to teach CCSS-Math MP.4 because it models an everyday problem using math. Students will very likely be in a similar situation to that of the problem, which similar factors, and will need the practice in solving this problem. The challenging part of this problem would be for students to calculate how fast each person will take to get to the destination because each person is walking at a different speed, but the teacher can instruct on how to set up this part of the problem so students don’t feel intimidated by it. Other than that, the students will be positively challenged to set up the problem using their knowledge of the Pythagorean Theorem to find side lengths and use their problem solving skills to find the answer and interpret it as well.

A.REI – Where Our Paths Intersect

Product image for Motion Detector

Students need a spike of interest in math class, especially when trying to solve systems of equations. Systems of equations tend to seem useless and not worth students’ time. Using the Vernier Motion Detector will prove to students that systems of equations can be applied to real world situations so it is useful and worth their time. This Vernier product can simultaneously record the motion data of two people, graph both motions on a common axis and find their intersections, find linear equations to model the motions, and compare the algebraic solution to the graphic solution. The Motion Detector will help keep students interested because it allows them using technology and actively create the systems of equations. Students can take at real world situation, create a system of equations out of it, and then solve the system.

Figure from experiment 27 from Real-World Math with Vernier

For example, students can imagine that a student is running to catch up to his friend who is walking ahead of him. This situation can be used to create a system of equations. For this example, we would solve a linear system of equations (students would be told to walk/run in at a constant speed). For future lessons, students can use the Motion Detector to solve other systems of equations and inequalities. The motions of the two students in the scenario can be modeled graphically by plotting the distance (y) versus the time (x) on the calculator to which the Motion Detector is attached. We can find the rate at which each of the two students traveled (x) and the total distance traveled (y). The plots can be made on the same set of axes, and the point where the two lines (paths of students) intersect represents the solution (the physical location where the two friends meet). Students can be assigned to groups of three. Each student will have a duty. Two students can do the walking that is detected by the Motion Detector and the other student is in charge of working with the calculator to graph the model and recording the information. Each group will make about three different models (by changing the rate at which they walk), so that they each have an opportunity to use the technology to detect their motion. Each student is expected to participate in analyzing the data to find the solution to the systems of equations they have created. Students would make their own table to plot the x and y values on their own piece of paper. When the Motion Detector creates the graph for them,  they will sketch the graph on their paper next to their tables. Students are also expected to reason their procedures and results on their paper (below their table and graph) and to each other in order to emphasize what they learned about the actual situation. For example, students may comment on how their answer (in ordered pair form) tells them that the student could have caught up to his friend faster if his rate of travel was faster with an inclusion of what the x and y values would look like).

This lesson would align with the HAS.REI.C.6 “Solve systems of linear equations exactly and approximately (e.g., with graphs), focusing on pairs of linear equations in two variables” since students are creating linear systems of equations with two variables, x (time, rate of travel) and y (total distance traveled), by walking or running at a constant rate and solving the systems (finding the location where their paths intersect).

This example lesson using the Vernier Motion Detector will allow students to see the physical steps in solving systems of linear equations, which will make it easier to learn and more difficult to forget the concept. This is because students will have experienced the actual situation in a real setting rather than looking at several different systems of equations that just seem repetitive and meaningless. This experience will have made a positive impact on students during class, so they will have a more positive attitude toward the lesson and toward their group members. Students may even use what they learned from using the Vernier Motion Detector to inform their parents, siblings, or friends about the concepts they learned from the lesson.

The Vernier Motion Detector can be found at http://www.vernier.com/products/sensors/motion-detectors/md-btd/ for $79.

N.RN – Rational Exponents

By Lisa Flores

N-RN Rational Exponents

Alignment: HSN-RN.A.

1. Use the Product of a Power Property to simplify these expressions

(you may further simplify using the Negative Exponents Property):

a. (32a) · (ab3c)

b. (2d5g4) · (3gr) · (dr3)

c. (4ad) · (b-2c) · (2a-4b6)

2. Use the Power of a Product Property to simplify these expressions

(you may further simplify using the Negative Exponents Property):

a. (a2b3d)5

b. (3f4g5k)2 · (m0)4

c. (3r2t-2w)2 · (2-1s3t5)-3

3. Use the Product of a Power Property and the Power of a Product Property to simplify these expressions with rational exponents:

(you may further simplify using the Negative Exponents Property):

a. (a1/2bc3) · (ab1/3c)

b. (2d3fg)1/2 · (3e2f2g4)

c. (4-1rs5)1/5 · (5s3t-2/3)1/3

Commentary

This task combines skills in using the Product of a Power Property, Power of a Product Property, and Negative Exponents Property separately, and then together, in a gradually challenging manner. Each skill is to be used separately first so that the exponent property to be used is straightforward. Then, the expressions gradually become more challenging in order to prepare for the more-complicated expressions in section 3. Each of the expressions will help to develops skills in simplifying the next, more challenging expression. Ultimately, with practice in using each of the other three properties of exponents in the task, the students will be prepared to reach the math standard HSN-RN.A. Extend the properties of exponents to rational exponents.

In section 3, each expression has rational exponents. The three exponent properties must be used in order to simplify the expressions which may be left as a negative exponent (like 4-1/5) or as a reciprocal of an exponent. The expressions in section 3 require the use of all properties while working with rational exponents which aligns with the content standard HSN-RN.A. Extend the properties of exponents to rational exponents.

The tasks that help to reach the standard HSN-RN.A. “Extend the properties of exponents to rational exponents” support student understanding of separate exponent properties. With practice in using all of the properties of exponents, students will be prepared to proceed on to applying the properties in mathematical problems, like solving problems with functions that have multiple bases and exponents, for example.

Solution

1. Problem: Use the Product of a Power Property to simplify these expressions

(you may further simplify using the Negative Exponents Property):

a. (32a) · (ab3c)

b. (2d5g4) · (3gr) · (dr3)

c. (4ad) · (b-2c) · (2a-4b6)

Answer:

a. (32a)(ab3c) = 9a2b3c

The exponents are added when the bases are the same

b. (2d5g4)(3g2)(dr3) = 6d6g6r3

Although bases 2 and 3 are not the same base, they are multiplied because they have the   same power

c. (4ad)(b-2c)(2a-4)(b6) = 8a-3b4cd or

2. Problem: Use the Power of a Product Property to simplify these expressions

(you may further simplify using the Negative Exponents Property):

a. (a2b3d)5

b. (3f4g5k)2 · (m0)4

c. (3r2t-2w)2 · (2-1s3t5)-3

Answer:

a. a10b15d5

The power outside the quantity is distributed to each base by multiplying the power of each base by the power of the quantity

b. 9f8g10k2m0 or 9f8g10k2

Any base to the power of 0 is equal to 1

c. (32r4t-4w2)(23s-9t-15) = 9 · 8r4s-9t-19w2  or

The answer may be left as a negative exponent or as a reciprocal of the exponent and its base, coefficients may be multiplied out or left as a product (9 times 8 or 72)

3. Problem: Use the Product of a Power Property and the Power of a Product Property to simplify these expressions with rational exponents:

(you may further simplify using the Negative Exponents Property):

a. (a1/2bc3) · (ab1/3c)

b. (2d3fg)1/2 · (3e2f2g4)

c. (4-1rs5)1/5 · (5s3t-2/3)1/3

Answer:

a. a3/2b4/3cor

Exponents are added using the Product of a Power Property

A whole number exponent and rational number exponent in the form of a fraction are added and left as a fraction or in radical form

b. (21/2d3/2f1/2g1/2)(3e2f2g4) = 3 · 21/2d3/2e2f5/2g9/2  or 3

Since bases 2, d, f, and g have their powers with the same denominator, they may be under the same radical

c. (4-1/5r1/5s1)(51/3s1t-2/9) = 4-1/551/3r1/5s2 t-2/9   or      or

Answers may be left with exponents in the form of a fraction with negative exponents, as exponents in the form of a fraction with reciprocals of bases and their powers, or as exponents in the form of a radical with reciprocals.

Each answer given above is simplified further in each version.


Here is the worksheet with just the problems (title and CCSS-math alignment included): Assessment Item-just problems


7.G-Using a picture to solve for arc measures

Ballet Folklorico de Mexico | September 22

(This picture was retrieved from the site: http://popejoypresents.com/2009-2010/ballet-folklorico-de-mexico)

A possible math problem students can solve, using this picture, is to find the angle and arc measurement created by the folkloric dancers’ arm, dress, and leg. This problem would align to:

CCSS.MATH.CONTENT.7.G.A.1
Solve problems involving scale drawings of geometric figures, including computing actual lengths and areas from a scale drawing and reproducing a scale drawing at a different scale and

CCSS.MATH.CONTENT.HSG.C.B.5
Derive using similarity the fact that the length of the arc intercepted by an angle is proportional to the radius, and define the radian measure of the angle as the constant of proportionality; derive the formula for the area of a sector

First, students can lay the picture on graph paper, plot points on the hand, armpit area, and foot of about three of the folkloric dancers and then use a compass to sketch an approximate arc from the hand to the foot (it should be an arc along the hem of the dress).

Once students have three separate sketches of arcs, they can calculate the length of the legs of the arc and the area of the arc. Then, students can discuss with each other what their answers mean and how their findings helped them reach the standards for this problem.

Using a picture to solve a mathematical problem will spark students’ interest because they will be intrigued by the picture and their answers will actually relate to a setting that makes their findings realistic. Slowly, teachers can find better ways to spark students’ interest by applying the math concepts they are learning to more realistic situations, gradually. In other words, a teacher may start off with a word problem one day, then progress to using a picture problem, and then have students solve a problem they can physically create and manipulate. Each of those situation becomes more realistic and intriguing to students.

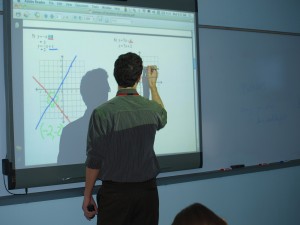
8.EE-Modeling Activity-SMART Board: helping solve systems of equations

This modeling activity can be useful for an Algebra teacher that wants to integrate technology in the curriculum. The central focus of this modeling activity is for students to gain confidence as they learn how to manipulate linear equations into slope-intercept form in order to graph the lines and find the solution. Since the modeling class size is small, about half of the students will be able to use the SMART Board, at a time, to help them reach the learning targets. Essential questions for students to answer during this lesson include:

  • What does a system of equations look like?
  • How do I graph a system of equations?
  • Can I graph an equation that is not in slope-intercept form?
  • How can I find the solution on the graph?
  • What does a written solution look like?
  • What is difficult about this method?
  • What do I like about this method?
  • When is this method best used?

Here is the detailed modeling activity plus the lesson plan :

Modeling Technology Explanation

Modeling Technology Lesson Plan

And here is a link to a video that can walk you through setting up a graph on the SMART Board:

A.REI-Using the SMART Board to solve systems of equations

In this article, you will learn about the 800 series SMART Board and its many features that can aid teaching of difficult math concepts. The SMART Board, an electronic white board, comes with access to countless pre-designed lesson plans that are easy to access and ready to use. These lesson plans are very organized and presentable, allowing teachers to efficiently plan to teach mathematical understanding, plan to support various students’ needs, and use knowledge of students to inform teaching and learning by integrating technology in the mathematics curriculum.

Specifically, the article describes how a teacher can use the SMART Boar to demonstrate how to create a system of equations by graphing two intersecting lines on the board’s graph and then creating the equations for the two lines. SMART boards are a great way for teachers to clearly demonstrate how they want their students to reach the learning tasks. The integration of this technology will spark students’ interest simply because they are using technology, so they are more willing to participate and therefore reach the learning targets.


OLYMPUS DIGITAL CAMERA

Math 325 Tech Article (1)